
【EA Real Operation】HISUI【Losing Pattern 1】
1. Introduction
Thank you very much for visiting.
I am the developer of "HISUI" an EA (Expert Advisor) named HISUI, Momo Imagawa.
Here, from the developer's perspective, I will explain how HISUI operates in real trading on my live account, including internal logic that can be publicly disclosed.
This is written to be helpful to people like the following, so if you're interested, please take a moment to read.
- Considering purchasing HISUI and want to see what kind of automated trading it actually does on a real account for reference materials.
- Not planning to buy HISUI, but interested in EA and want to study and reference real-world operation as a learning resource.
- Already purchased HISUI and actively using it, but concerned whether it is functioning correctly (e.g., automated trading is happening, but are entries and exits as specified?).
I plan to serialize several articles on HISUI's real-world operation across patterns such as winning (profitable) patterns, losing (loss-making) patterns, and break-even near zero exits, in multiple posts (all articles will be published for free).
Previous articleintroduced two winning patterns for HISUI, so as announced, this time I will introduce the losing patterns.
2. HISUI's Losing Pattern A
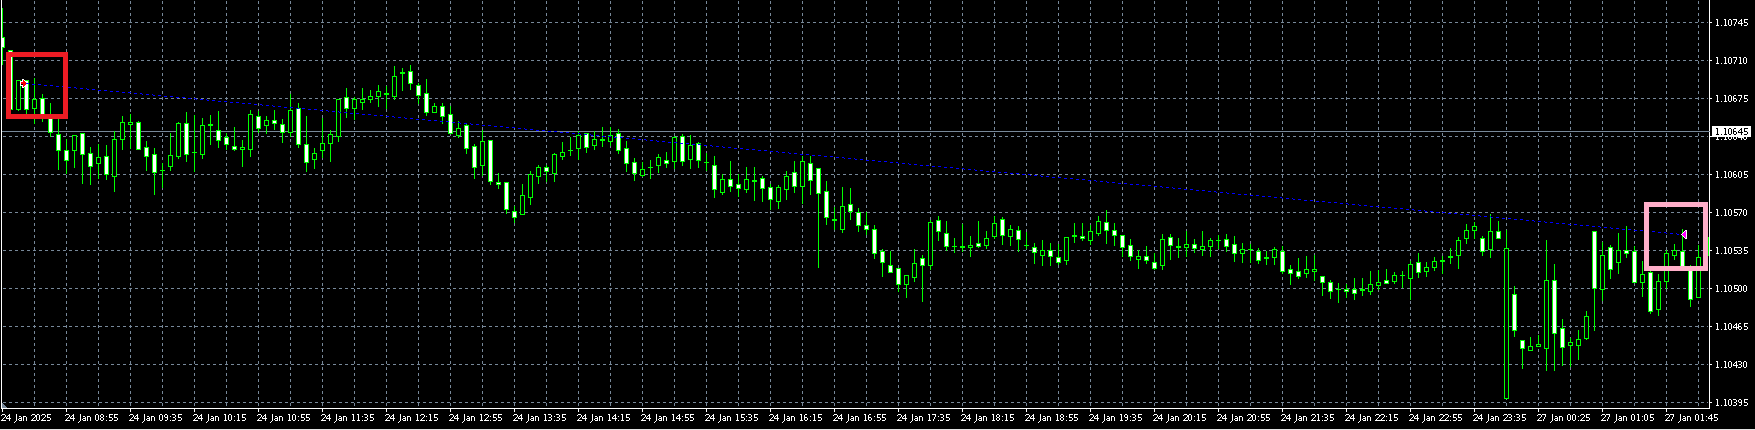
The figure below shows a real trade result entered on Friday, January 24, 2025 and stopped out on Monday, January 27. The chart is a 5-minute chart (M5); the red arrows indicate long entries and the pink arrows indicate exits (the image is wide, so the red-framed area and pink-framed area highlight these points for clarity).
Before discussing this trade, I will explain the baseline exit method used by HISUI.
HISUI's exit patterns are complex. The pips to take profit (TP) or stop loss (SL) are not fixed; when market movement is volatile, TP/SL are set farther away, and when movement is narrow, TP/SL are set closer. After entry, the system continually recalculates optimal exit positions based on price fluctuation and position holding time.
Also, HISUI sets TP and SL at entry, but this is mainly a precaution against situations where MT4 stalls (e.g., VPS maintenance or outages). In most cases, positions are closed by market order at prices calculated by the recalculation above.
Furthermore, the TP/SL prices set at entry are intentionally placed somewhat farther for the following reasons:
- Reason for setting TP slightly farther: to ensure sufficient profit if a sudden positive gap occurs due to economic data releases. If TP is near, such cases would cap profits.
- Reason for setting SL slightly farther: to prevent being stopped out by temporary spreads widening in the morning. If SL is near, temporary spread widening could trigger a stop-out, and when spreads return to normal, the price could revert, causing missed profits in many cases.
Now, back to the main discussion, the explanation of the trade shown above.
This trade went long on Friday, January 24, but then moved into a gradual downtrend and was finally closed by stop loss on Monday morning, January 27.
There are two points to note here.
(1) Not closing out on Monday morning when the spread widens
In Japan, the equivalent of Monday morning is around this red-framed area (the near exit point is excerpted from the upper chart; the date/time at the bottom of the image is shown in display time plus 7 hours, not Japan time).
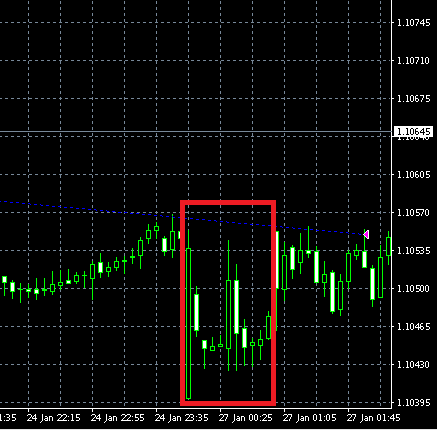
Generally, spreads tend to widen on Monday mornings, and here the spread widened by about 300 points.
If one had stopped out at such a point, losses would include the spread widening itself.
As you can see, Monday morning spread widening often reverts to the original price as time passes (except in cases of major events impacting currencies over the weekend).
Therefore, as described above, HISUI's exit strategy normally does not close positions during Monday morning spread widening; it waits for the spread to narrow.
(2) Exiting at a level that is not the bottom but has rebounded somewhat
Even after spreads narrow, the price may still move up and down as shown in the red-framed area below; HISUI exits not at the low but at a rebound point, if any.
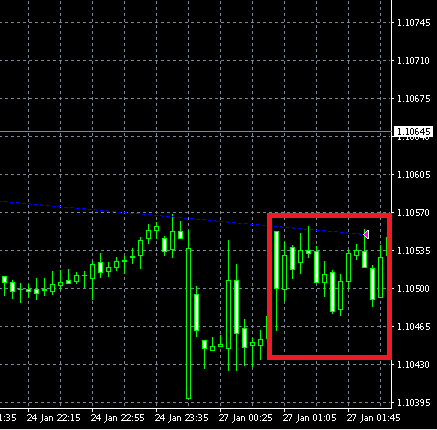
This is another HISUI exit strategy (hereafter called "Profitable-Price Exit").
You can configure the holding time to actively initiate profitable-price exits, with the initial (recommended) setting at 1020 minutes (17 hours). In other words, after 17 hours from entry, the likelihood of a profitable-price exit increases.
Note that even before this setting time is reached, depending on market movements there are cases where profitable-price exits may occur.
Thus, HISUI has logic to minimize losses as much as possible, even in loss-making patterns.
3. HISUI's Losing Pattern B
Next, another losing pattern is introduced. The figure below shows a real-trade result from January 31, 2025. The chart is a 5-minute chart (M5); the blue arrows indicate short entries and the pink arrows indicate exits.
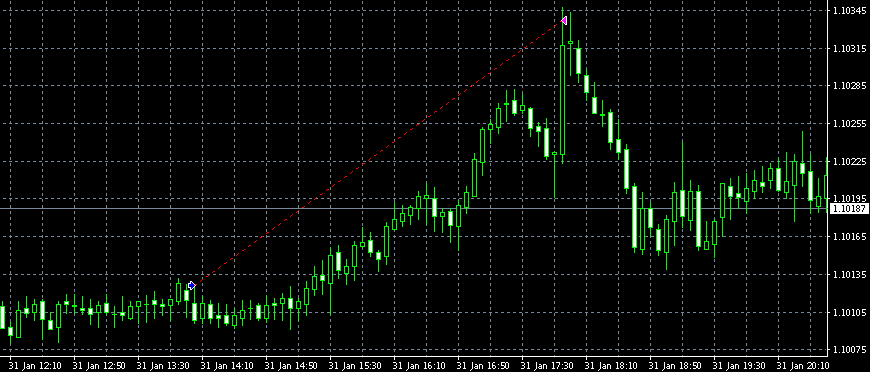
As shown, after entry, if the price moves sharply in the opposite direction from expectations, it may not allow a profitable exit and result in a stop-out.
However, because the price reached the stop-out level only on a market order before hitting the SL, the loss stays below the amount defined by the "risk percentage of available margin" parameter, thus risk is properly controlled.
Also, in hindsight, after the stop-out, the market moved higher, meaning that if waited, a profitable exit might have been possible (hindsight is 20/20; stopping out here could have increased losses if not done)…
The distance to stop-out can be configured to be farther or closer by changing parameters.
If you make such parameter adjustments, please consider carefully and implement prudently.
In particular, it is not advisable to frequently change parameters based only on the latest few moves, as this is likely to overfit to recent market conditions.
When determining HISUI's recommended settings, I do not rely solely on backtesting optimizations; I perform walk-forward testing and real account forward testing. In general, increasing backtest duration and trade count reduces the risk of curve fitting, so HISUI is adjusted to achieve sufficient win rate and profit with backtest durations of 15 years and over 10,000 trades.
Thus, as a creator, I publish HISUI with the initial (recommended) settings believed to be the best at the time of release (note: this does not guarantee optimal performance for all future market conditions or continuous profitability).
4. About HISUI's Second Entry
Previous articlealso noted that HISUI can hold up to two positions.
However, in the above losing patterns, only one position was held.
This is another HISUI characteristic: the second position is not entered for averaging down when the first position loses ground.
HISUI only makes a second entry if the market is judged to be in a range and the second entry can be made at a more favorable point than the first position (note: in most cases, the entry price for a long would be higher for the second position, and lower for the second position when short; however, depending on market conditions and slippage, the opposite can occur).
Therefore, after taking the first position, if a trend develops before the second entry, a second position is not taken.
However, theoretically there are cases where a range market leads to a second position and both positions experience stop-out; fortunately, since real trading began in January 2025 up to the time of this article, such cases have not occurred yet.
5. Conclusion
This time, I introduced and explained two losing patterns in HISUI's real-world operation.
If losses continue, you may worry about whether to keep running the EA or whether parameter adjustments would help.
Therefore, in the next article I plan to write about how to think and maintain your mindset when losses continue in real EA operation (→I wrote).
If you found this article helpful or would like to read the next article, please bookmark theSeries Pageto receive notifications when new articles are posted.
The product page for the HISUI described and explained in this article ishere.
× ![]()