
[EA Real Operation] HISUI [Winning Pattern 1]
1. Introduction
Thank you very much for visiting.
I am the developer of “HISUI,” the Expert Advisor (EA).
Here, from the developer’s perspective, I will explain how “HISUI” operates in my real account, including internal logic that can be publicly disclosed.
The following content is written to be helpful to readers like the ones below, so if you are interested, please read on.
- I am considering purchasing “HISUI” and want to see what kind of automated trading it performs in a real account for reference materials.
- I am not considering purchasing “HISUI”, but I’m interested in EAs, and I would like to study and refer to real-operation introductions and explanations to deepen my understanding of EAs.
- I have already purchased “HISUI” and am actively using it, but I’m worried whether it’s operating normally (e.g., the automated trading is running, but I’m unsure if the entry and exit positions are as specified).
The real-time operation of “HISUI” will be divided into several patterns—winning (profitable) patterns, losing (loss-making) patterns, and pullback near break-even patterns—and serialized over multiple articles (all articles will be published for free).
Since this is the first installment, I will introduce and explain two patterns in which we could have comfortably won.
2. Winning Pattern of “HISUI” (A)
The figure below is one of the real-trade results of “HISUI” on January 22, 2025. The chart is a 5-minute chart (M5); the blue arrows indicate short entries, and the pink arrows indicate exits.
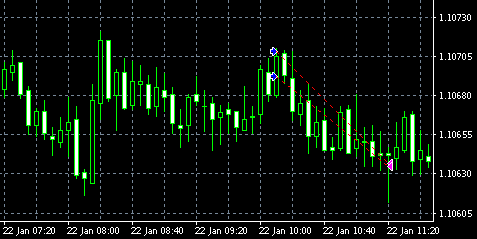
This is one of the ideal patterns that “HISUI” aims for.
As a basic premise, “HISUI” identifies the range in the 5-minute chart (※) and uses a strategy of “short near the upper end of the range → exit near the lower end,” or “long near the lower end → exit near the upper end.”
(※) The logic for identifying this range is the most important core part of HISUI, so the details of this logic are not disclosed.
First, focusing on the entry position in the figure above (blue arrow), the first short is entered slightly above the average of the range, and the second short is entered near the upper limit.
As described in HISUI’s product description, the first position is entered a little early to avoid missing a good chance, while the second position is entered at a point judged to be even more advantageous based on calculations.
Note that HISUI’s maximum number of positions is 2, and the logic does not allow hedging or opening two opposite positions, so even if the price trends upward after the second short, there is no averaging or hedging.
Next, looking at the exit positions (pink arrows), both positions are exited at almost the same level (allowing for slight displacement due to slippage, etc.).
This is HISUI’s specification: the logic determines a single optimal point based on price movement and closes at that point.
During development, we also considered and tested a partial-exit feature, but with HISUI’s logic, closing all at one point yielded better performance over the past 15 years of backtesting (total profit and win rate).
Therefore, HISUI does not implement partial exits, and it cannot be configured to do so through parameter changes.
※ It is important to note that this does not mean partial exits would be ineffective for other EAs or trading strategies; it simply was not effective for HISUI.
3. Winning Pattern of “HISUI” (B)
Next, I will introduce and explain another trade from the same day (January 22, 2025). As above, the chart is a 5-minute chart (M5), with blue arrows for short entries and pink arrows for exits.
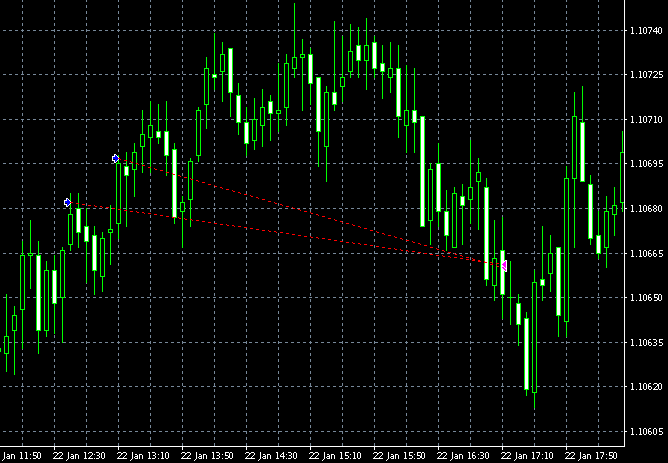
In this trade, the entry position was not ultimately optimal, as the price went higher after the short.
This means that HISUI’s calculated upper limit of the expected range was breached.
One strategy in range trading is to cut losses immediately if the expected range is breached.
However, the expected range is purely a calculation, and there is no guarantee it will be exact in all markets. If you repeatedly take losses due to unexpected moves, you may end up with “loss-streak poverty.”
Also, there is a strategy where, if the upper limit of the range is breached and a rising trend is expected, one would go long, but sometimes it is a false breakout and prices return to the range or move into a downtrend.
From experience, shorter timeframes tend to have more false signals. HISUI is designed (recommended) for the short 5-minute timeframe, so to account for the possibility of false signals, the stop loss is set relatively wide.
As a result, in trades like this, even if the upper limit of the expected range is breached, the price does not enter a sustained uptrend and a return allows for profitable exits.
4. Conclusion
In this article, I introduced and explained two winning patterns of HISUI’s real-world operation.
There are other winning patterns as well, which I plan to cover in separate installments within the series.
However, merely presenting winning patterns would not be fair, so next I plan to write an article explaining and analyzing losing patterns as well (2025-02-02 update: written →here).
As mentioned earlier in this article, HISUI’s real-world operation will be serialized across multiple articles, divided into patterns such as winning, losing, and break-even patterns (all articles will be published for free).
If reading this article was helpful or if you’d like to read the next article as well, please go to theSeries Pageand bookmark it to receive notifications when new articles are posted.
The product page for HISUI that was introduced and explained in this article ishere.
× ![]()