

US CPI and mBDSR signs and SRF2 signs (surge countermeasures)
0
Indicator that shines when combined with RCI: 【BODSOR・mBDSR】
Methods and Case Studies (PDF) ★GogoJungle AWARD 2020 Winner★
https://www.gogojungle.co.jp/tools/indicators/11836
A PDF file with 250 items is attached.Many of them are examples that lay out a process of logically linking the higher and lower timeframes using three RCI lines, sequentially examining multiple lower timeframes, and ultimately waiting for timing to buy on dips or sell on rallies in the lower timeframe (= mBDSR signal).The explanation usesover 950 charts in total.

EURUSD 5-minute chart
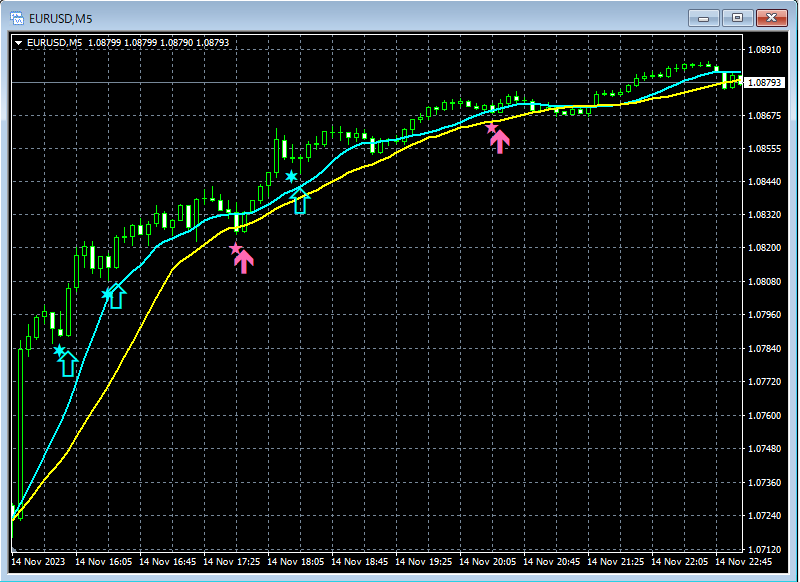
Movement after US CPI release.
Three signals of the selling pressure precaution SRF2 (for sharp rise/fall) lighting up.
Two signals of the dip-buying with mBDSR (MA filter).
Sold separately: SRF2 (for sharp rise/fall)
https://www.gogojungle.co.jp/tools/indicators/16700
Indicator that shines when combined with RCI: 【BODSOR・mBDSR】
Methods and Case Studies (PDF) ★GogoJungle AWARD 2020 Winner★
https://www.gogojungle.co.jp/tools/indicators/11836
A PDF file with 250 items is attached.Many of them are examples that lay out a process of logically linking the higher and lower timeframes using three RCI lines, sequentially examining multiple lower timeframes, and ultimately waiting for timing to buy on dips or sell on rallies in the lower timeframe (= mBDSR signal).The explanation usesover 950 charts in total.
× ![]()


