

Considerations on the rationale for selling “RCI3 Three-Line + mBDSR” ~ Example of a one-hour level rebound sell (2)
Note: This article is a transplant from the Gogojungle blog dated July 25, 2020, created for Investment Navigator Plus as the Gogojungle blog ended.
An indicator that shines in combination with RCI: BODSOR and mBDSR
https://www.gogojungle.co.jp/tools/indicators/11836
An indicator developed to improve entry accuracy when buying on pullbacks or selling on rallies using three RCI lines
Taking yesterday (July 24, 2020) USD/JPY as an example,“Reason to sell”I would like to write a little about it.
The effective use of ‘RCI three-line + mBDSR’is considered very important.
USD/JPY 4-hour chart
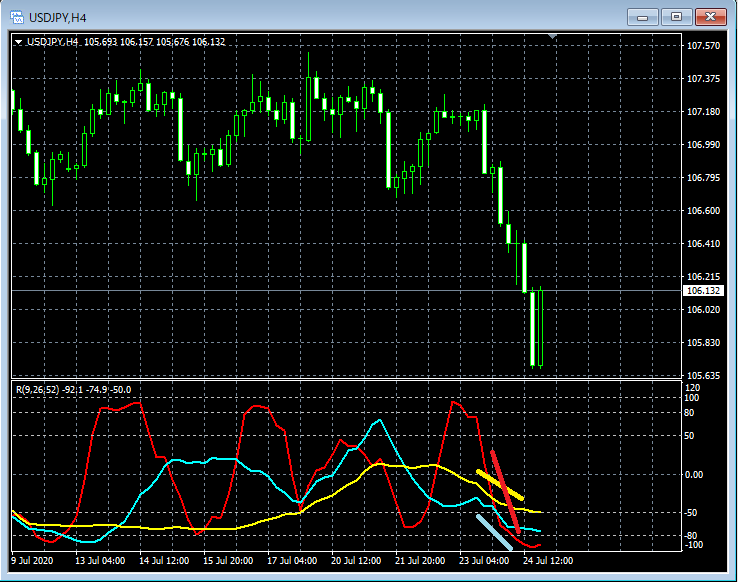
Lower part: RCI three-line (RCI9, RCI26, RCI52)
Yesterday, the three-line RCI was aligned downward, forming a very weak pattern.
Next, look at the lower time frame, the 1-hour chart.
USD/JPY 1-hour chart
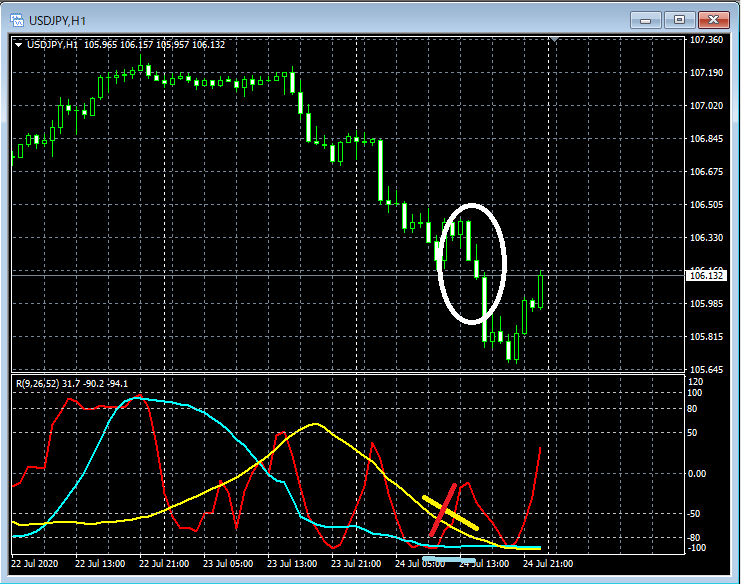
Lower part: RCI three-line (RCI9, RCI26, RCI52)
Looking at the 1-hour chart, there was a moment when only RCI9 among the three lines rose clearly.
〇 The higher-timeframe 4-hour chart is maintaining a very weak pattern
〇 If RCI9 on the 1-hour chart reverses downward, there is a possibility that all three RCI lines will again align in a very weak downward pattern
Considering these two points, it might not be strange to consider selling on rallies at the 1-hour chart level first.
Here, we will look at the behavior around the area circled in white in the upper chart using the lower-timeframe 5-minute chart.
USD/JPY 5-minute chart

Upper part:mBDSR signal (Filter: RCI26, RCI52), line indicating the recent high
Lower part: RCI three-line (RCI9, RCI26, RCI52)
Looking at the 5-minute chart, price barely failed to reach the recent high and reversed downward. On the ensuing rally,mBDSR pullback-sell signallights up. And from right after the pullback-sell signal lights up, four consecutive bearish candles appear and the price declines steadily.
In this case…
〇 The 4-hour chart is showing a very weak pattern
〇 At the 1-hour level, it is not strange to target selling on rallies
〇 On the 5-minute chart, the price failed to reach the recent high and reversed
With these conditions overlapping, it is more than justmBDSR pullback-sell signalbeing lit up;“Reason to sell”
Although this indicator has been on the market for over three years, it has occasionally contained notes that may be helpful for considering the effective use of‘RCI three-line + mBDSR’and, as of now (July 25, 2020), there are 13 bonus PDFs available. These are compiled from time to time.
Note: In the charts shown in this article, for convenience and explanation, circles, lines, and rectangles may be added.
An indicator that shines in combination with RCI: BODSOR and mBDSR
https://www.gogojungle.co.jp/tools/indicators/11836
Note: An indicator developed to improve entry accuracy when buying on pullbacks or selling on rallies using three RCI lines


