
PD Arrays (Premium & Discount Arrays) – Beginner Breakdown
What are PD Arrays?
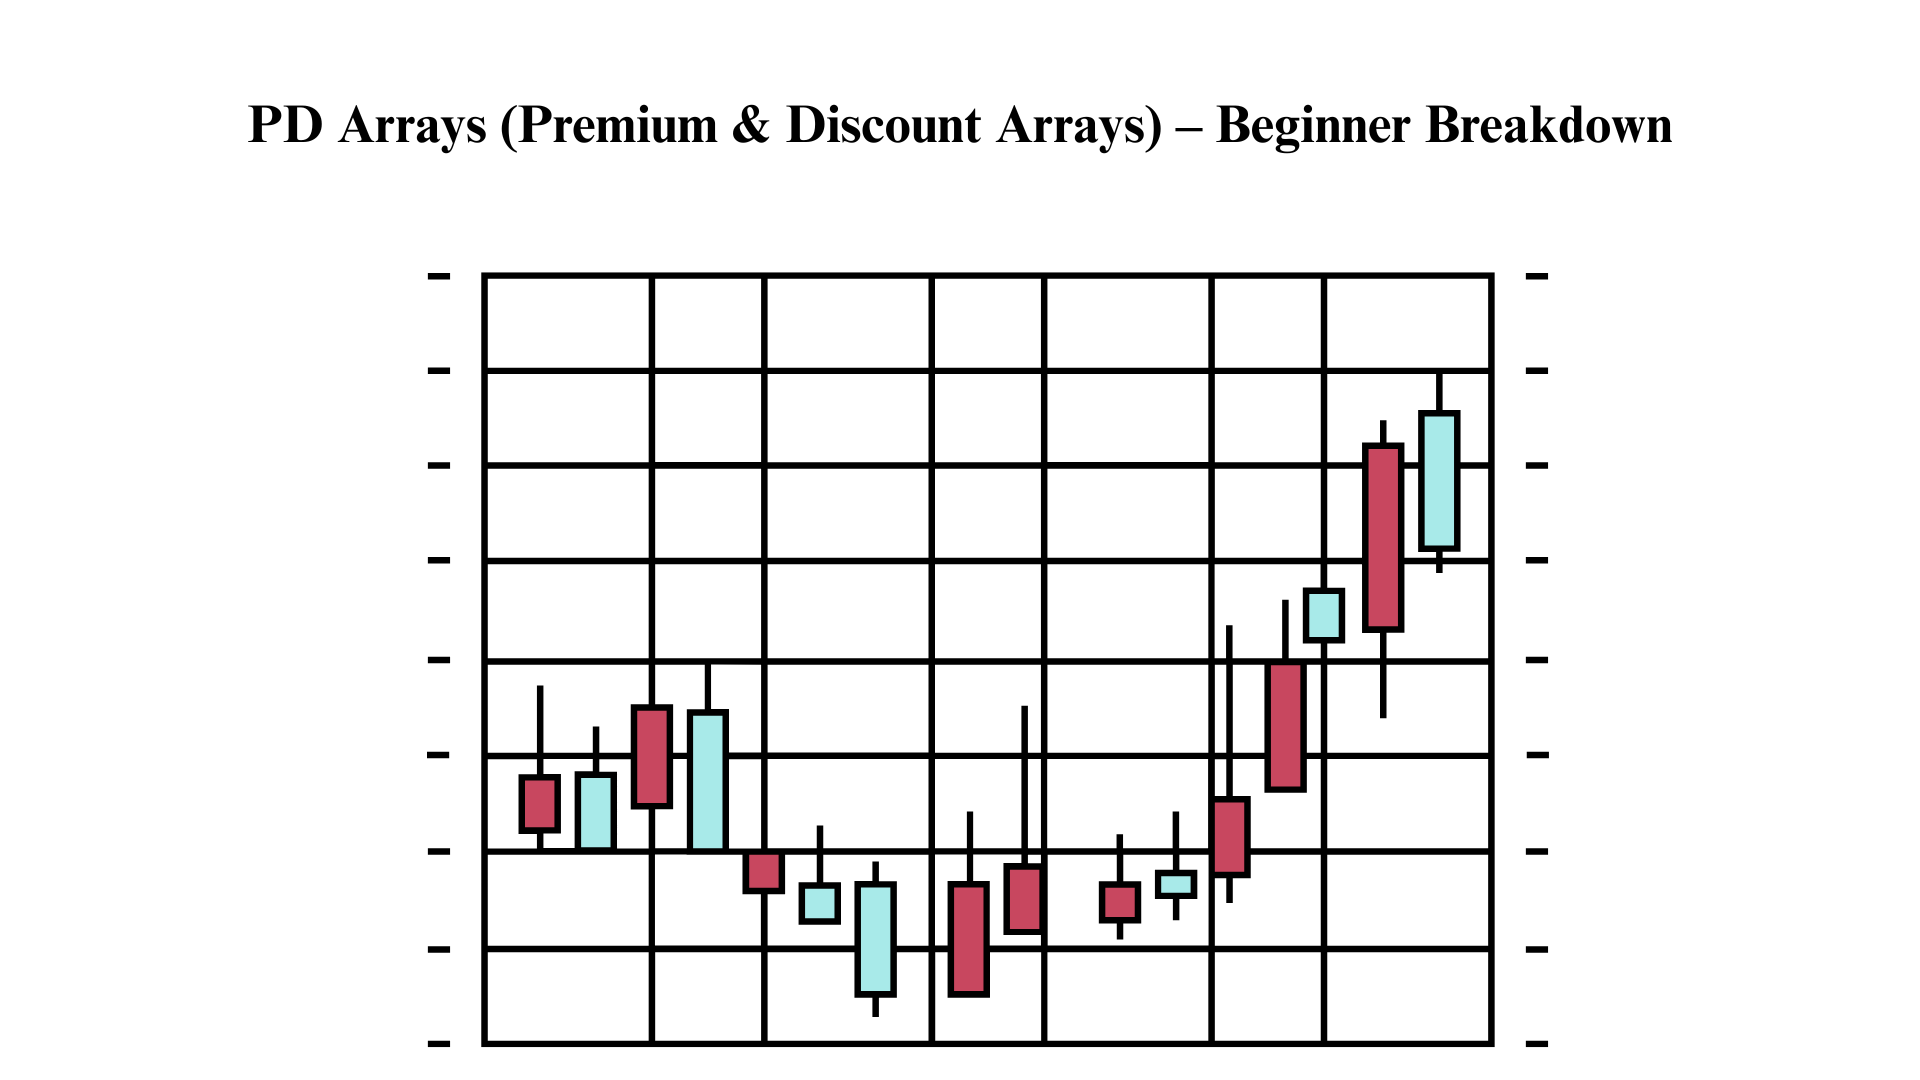
In ICT methodology, PD Arrays are specific price levels or zones where the market is likely to react — things like order blocks, Fair Value Gaps, breaker blocks, liquidity voids, etc. They're the "magnets" and "bounce points" on your chart. The key rule: you identify them on the higher timeframe and trade them on the lower timeframe .
What the Diagram Shows
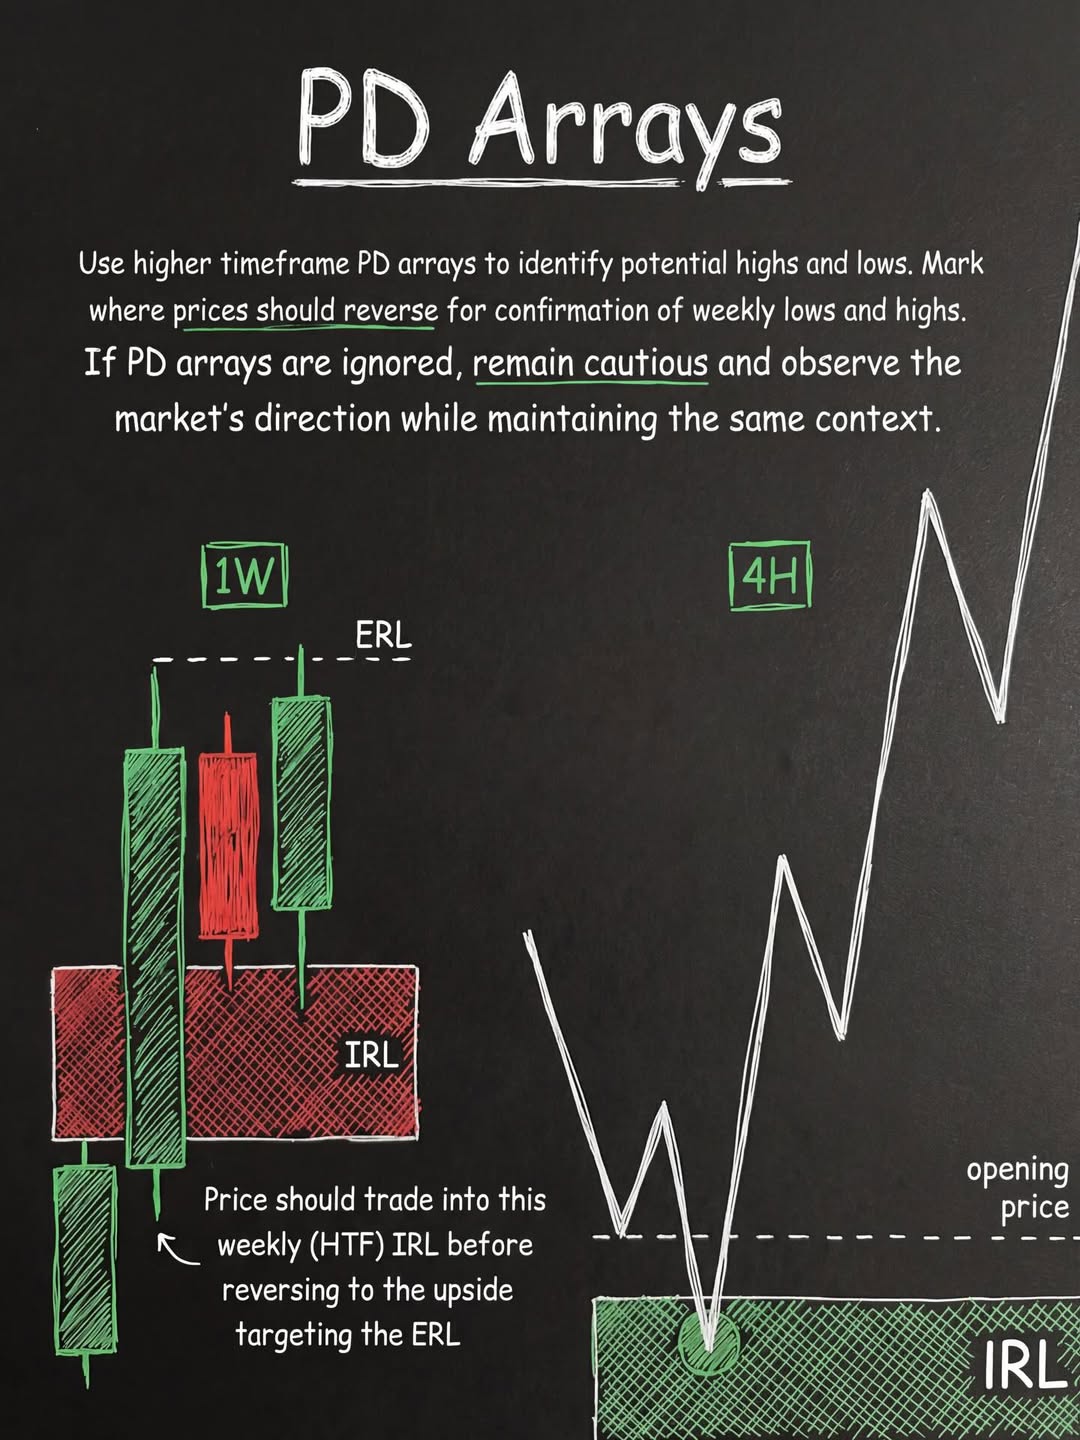
The Weekly Chart (1W) — Left Side
The weekly candles show two critical levels:
- ERL (External Range Liquidity) — the high of the range, marked with a dashed line at the top. This is the target — the liquidity sitting above the highs that price wants to reach.
- IRL (Internal Range Liquidity) — the red zone in the middle/lower area of the candles. This is an internal PD array (like an order block or FVG) where price should pull back into before reversing.
The annotation says it clearly: "Price should trade into this weekly (HTF) IRL before reversing to the upside targeting the ERL."
The 4H Chart — Right Side
This zooms into what actually happens on the lower timeframe. Price drops from the opening price down into the IRL zone at the bottom (the weekly PD array), then reverses and rallies upward in a zig-zag pattern, ultimately targeting the ERL high above.
The Concept in Plain English
Think of it as a two-step process:
- Where will price go to refuel? → Into the IRL (the internal PD array — a discount zone where smart money fills orders)
- Where will price go after refueling? → Up to the ERL (the external liquidity — the highs where stop-losses are sitting)
Price moves from internal liquidity to external liquidity . IRL is your entry area, ERL is your target.
The Warning
The text at the top also cautions: if price ignores the PD array (blows right through it without reacting), don't force the trade. Stay cautious, observe direction, and keep the same context until a new setup forms.
Bottom line for beginners: Mark your key zones on the weekly chart (IRL and ERL), drop to the 4H to wait for price to tap the IRL, then trade the reversal targeting the ERL. Higher timeframe gives direction, lower timeframe gives entry.
Two powerful trading tools. One serious edge.
Tired of second-guessing your entries? These two precision indicators — available for both MT4 and MT5 — do the heavy lifting for you.
Divergence Matrix Scanner — MT4 | MT5
Catch divergence signals before the move happens. This scanner monitors 10 indicators simultaneously — RSI, MACD, Stochastic, CCI, OBV, CMF, MFI and more — across 20 pairs x 9 timeframes in real time. Both regular and hidden divergence detected. Nothing slips through.
Forex Stellar Signal Dashboard — MT4 | MT5
Get crystal-clear BUY and SELL signals directly on your chart. This dashboard scans 20 currency pairs across all timeframes — from M1 up — and also works on XAUUSD, US30, and NAS100. No guessing. Just clean, actionable signals with visual alerts.