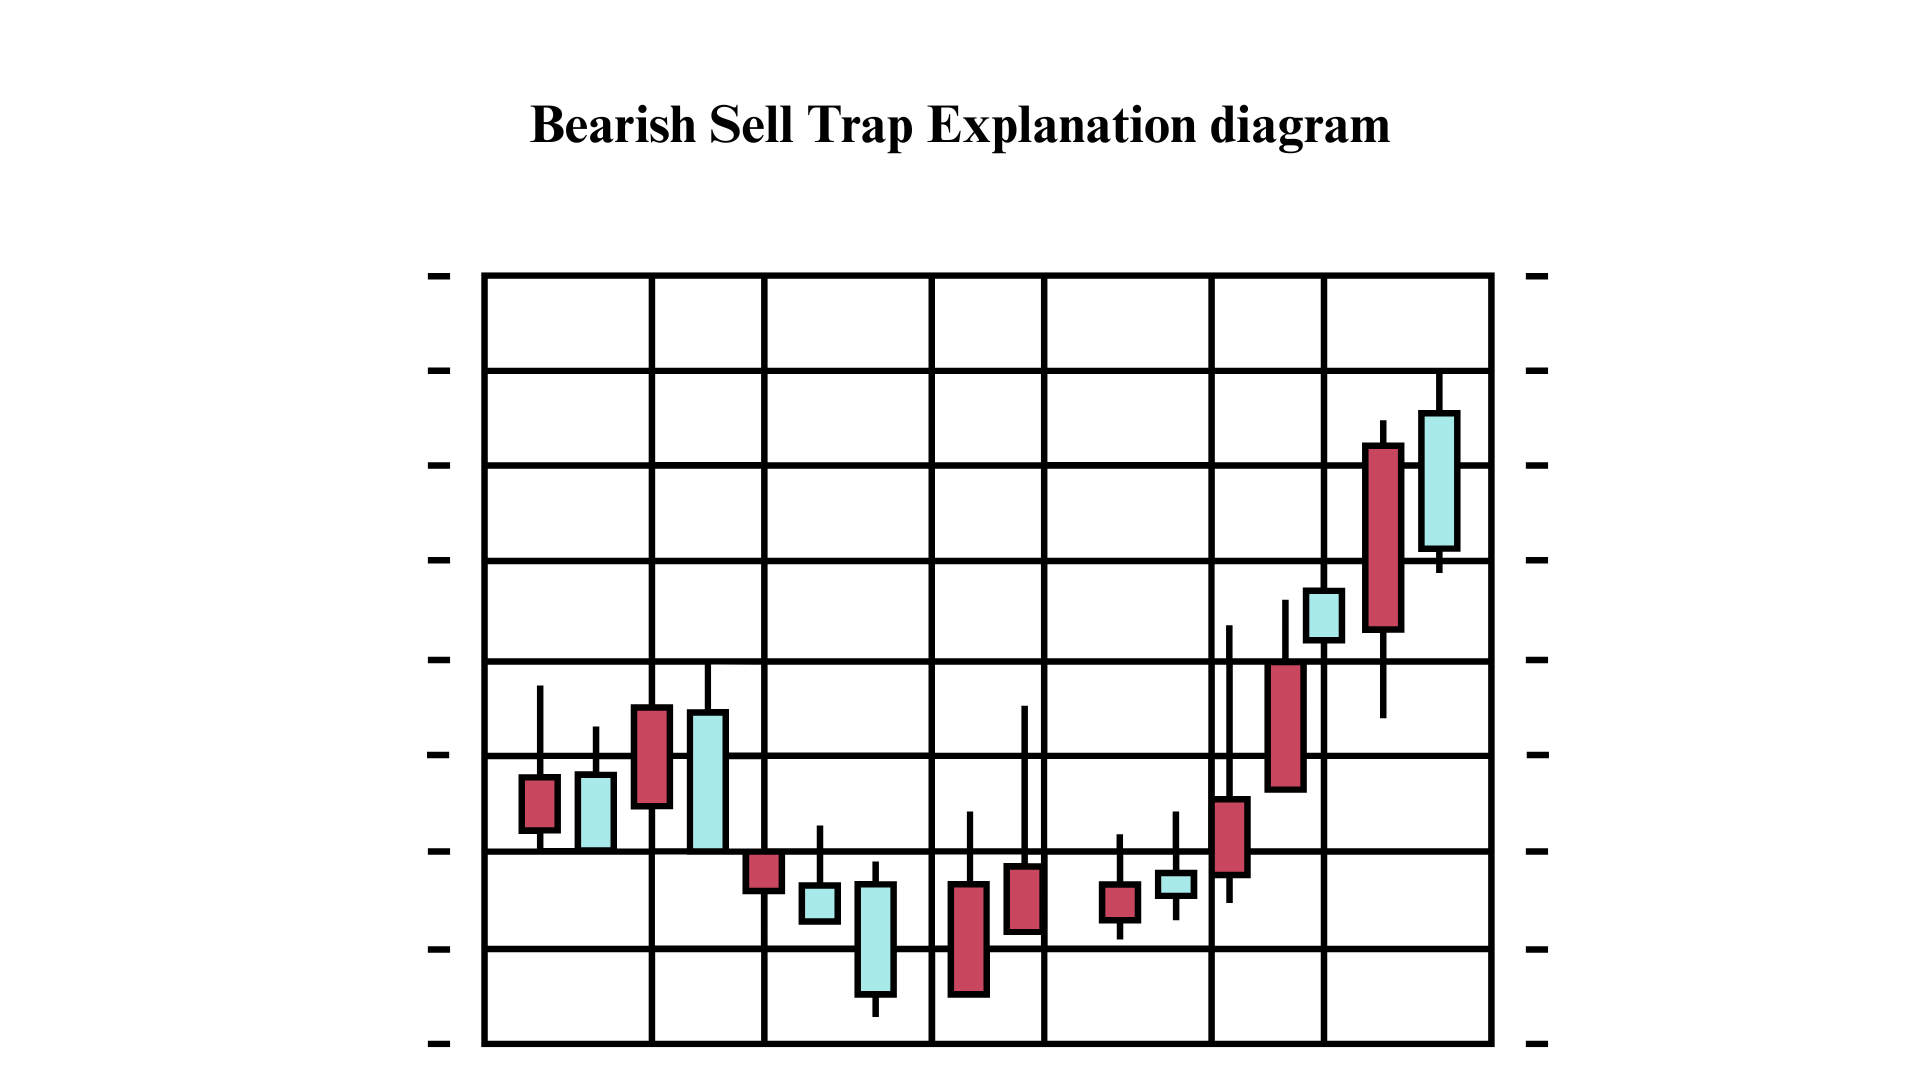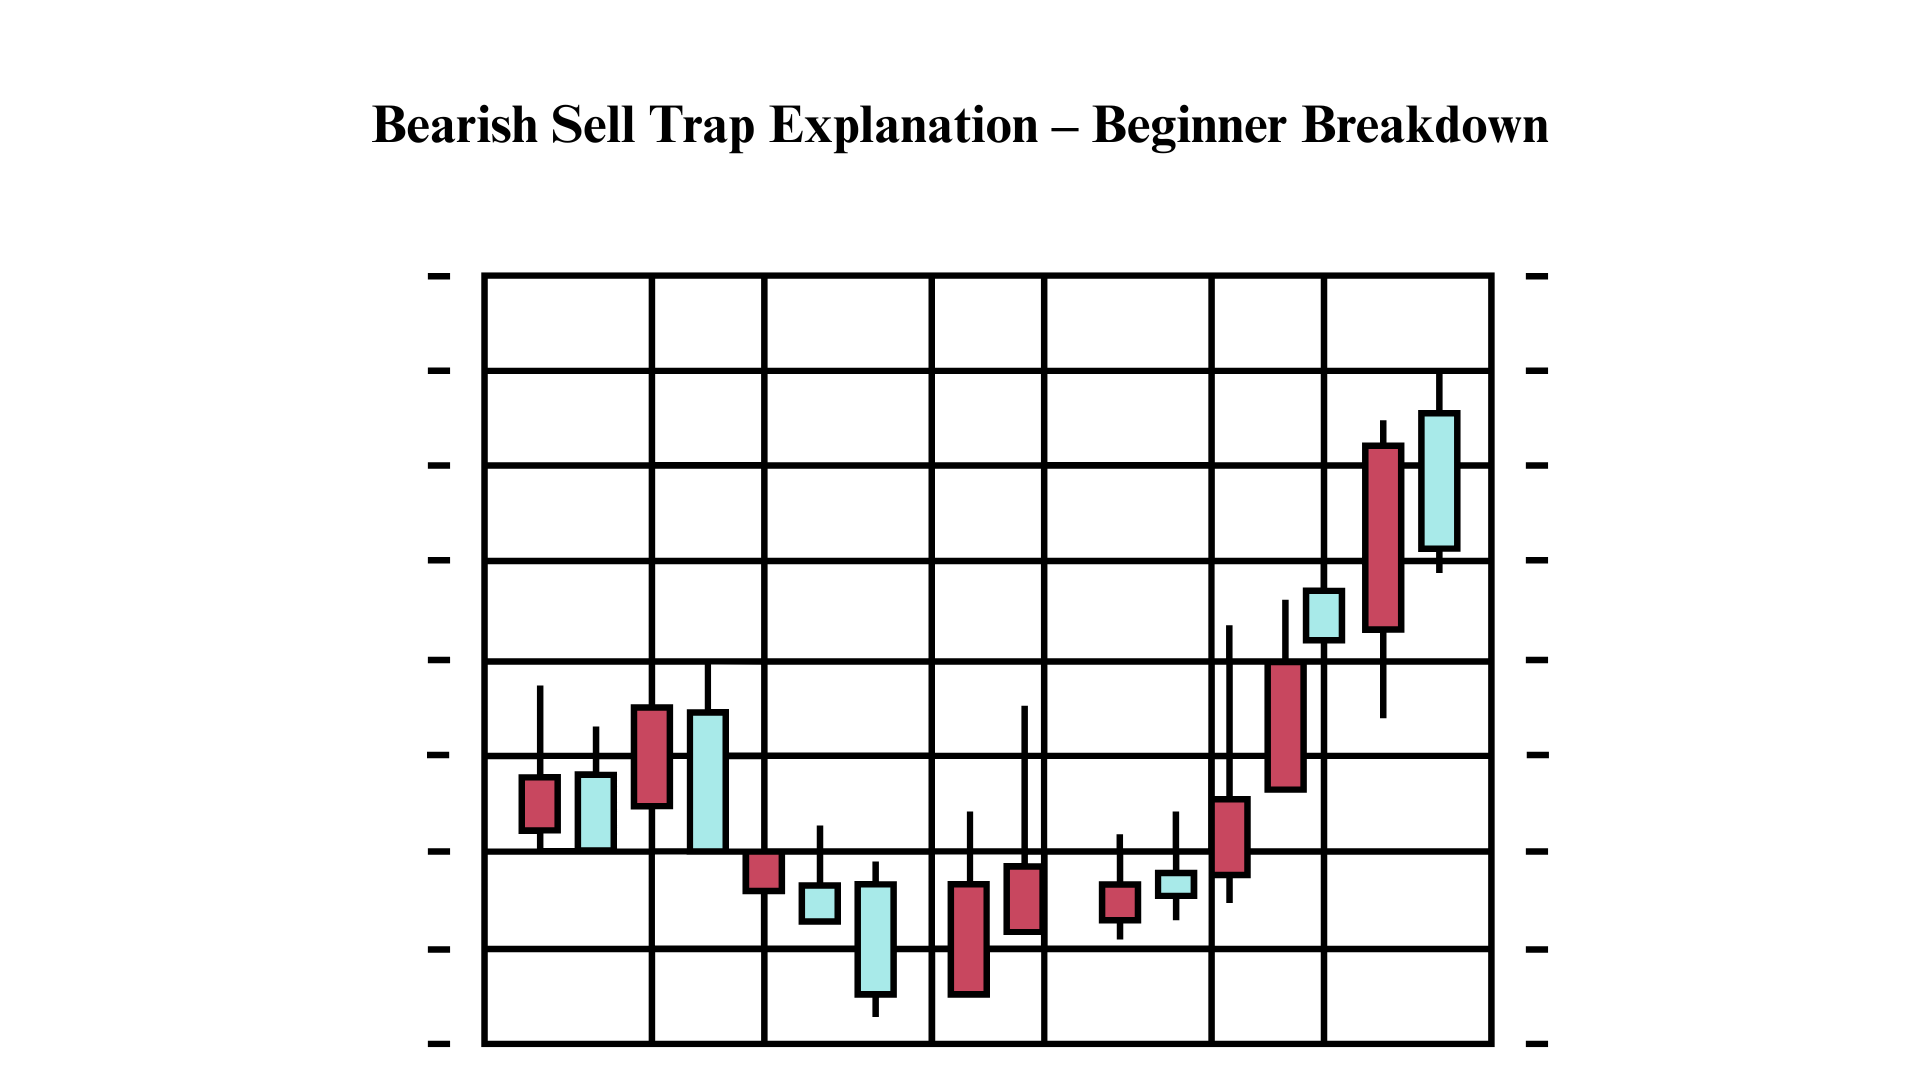

Bearish Sell Trap Explanation diagram
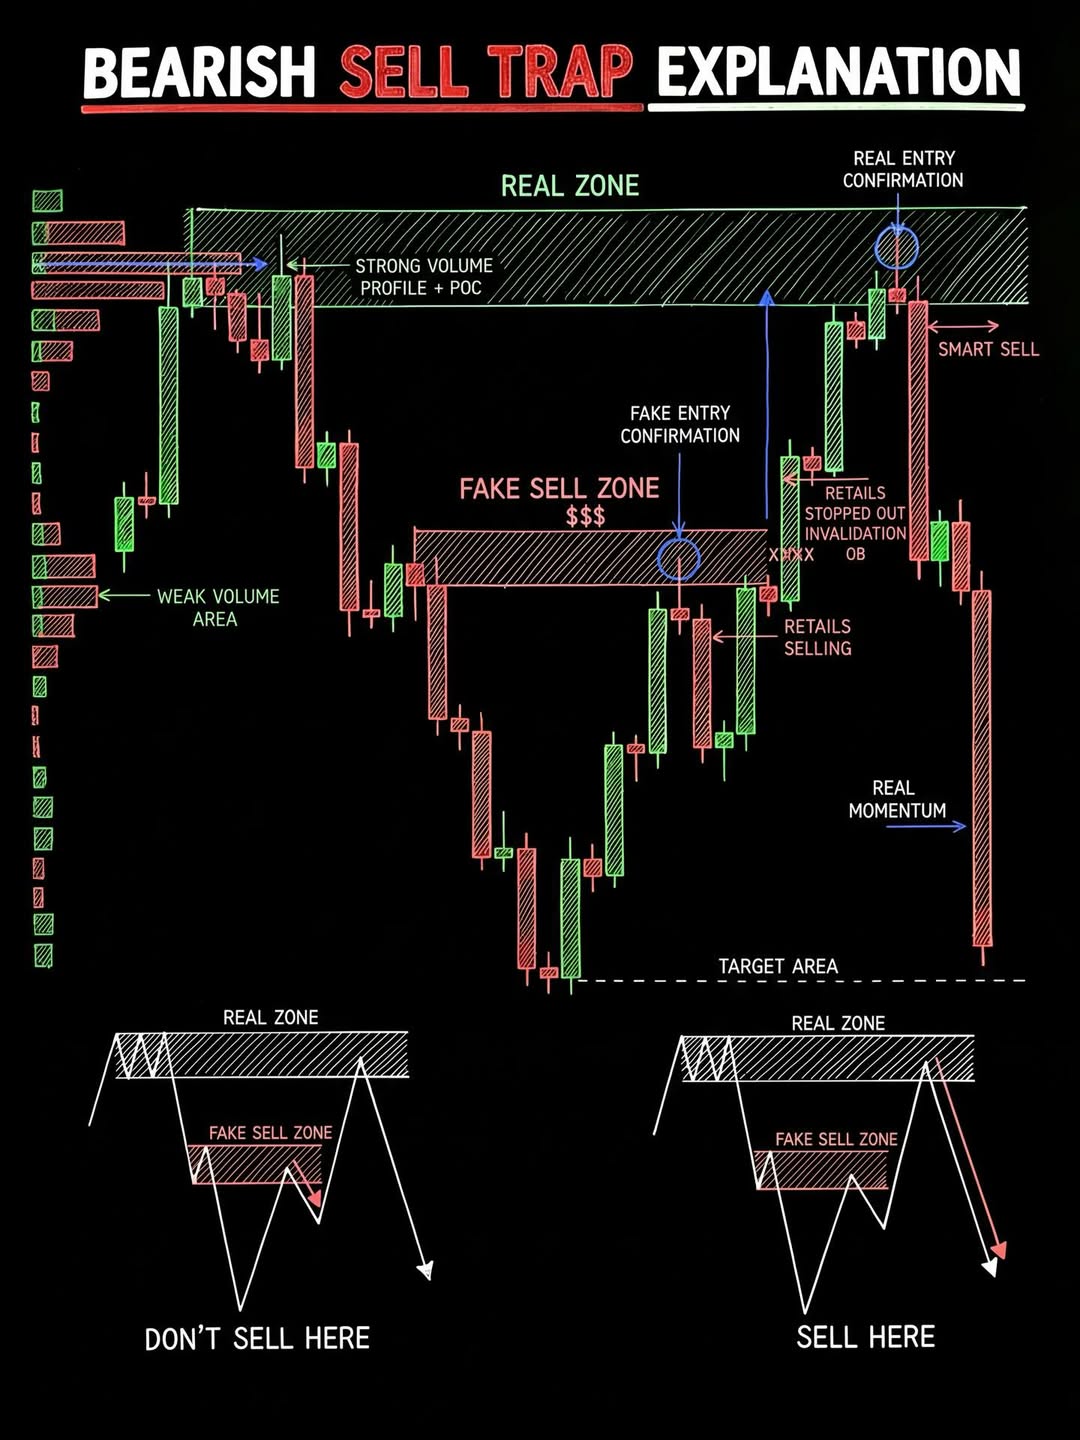
This is the same Bearish Sell Trap Explanation diagram I already broke down for you earlier (just the dark/black background version of the same image). The content, labels, and structure are identical.
Here's a quick recap:
The core lesson: Smart money creates a Fake Sell Zone in the middle of the range to bait retail traders into selling too early. Those retail shorts get stopped out when price pushes back up, providing liquidity. The Real Zone is at the top — backed by strong volume profile + POC — and that's where the actual institutional selling happens.
The two bottom diagrams:
- Don't Sell Here = selling at the Fake Zone (the trap)
- Sell Here = waiting for price to sweep that trap, return to the Real Zone, and selling with confirmation there
Two powerful trading tools. One serious edge.
Tired of second-guessing your entries? These two precision indicators — available for both MT4 and MT5 — do the heavy lifting for you.
Divergence Matrix Scanner MT4 MT5
Catch divergence signals before the move happens. This scanner monitors 10 indicators 20 pairs x 9 timeframes simultaneously — RSI, MACD, Stochastic, CCI, OBV, CMF, MFI and more — across in real time. Both regular and hidden divergence detected. Nothing slips through.
Forex Stellar Signal Dashboard MT4 MT5
Get crystal-clear BUY and SELL signals directly on your chart. This dashboard scans 20 currency pairs across all timeframes — from M1 up — and also works on XAUUSD, US30, and NAS100. No guessing. Just clean, actionable signals with visual alerts.