

Master RCI to the extreme!! Signals of Double Top and R1R2S2 AUDJPY 5-minute chart
=================
[Iron Plate Pattern] Signaling signals from a confluence of a rising price, Fibonacci, and RCI oversold with R1R2S2
USD/JPY 1-minute chart
https://www.gogojungle.co.jp/finance/navi/articles/97494
=================
Participating in the “Early Autumn Gogotoku Festival.”

[Mastering RCI!! Trend Reversal, Buy on Dips, Sell on Rallies]
An indicator that shines in combination with RCI: [BODSOR・mBDSR]
Method & Case Studies (PDF) ★GogoJungle AWARD 2020 Winner★
https://www.gogojungle.co.jp/tools/indicators/11836
R1R2S2is included in the above product. For details, please read the article below in the Investment Navi+.
RCI 3-line “2-step Judgment” to target trend reversals, buying on dips, and selling on rallies with the indicator “R1R2S2” released!!
* This product [BODSOR・mBDSR] includes, in addition to the standard, 358 PDFs (over 1,400 pages, more than 1,350 charts, over 470,000 words) as part of its method & case studies.
* In addition to the above PDFs, there are 31 PDFs (methods & case studies: over 120 pages, over 115 charts, over 40,000 words) included to effectively utilize R1R2S2.
PDF collection to effectively utilize R1R2S2【Master RCI to Win!!】
https://www.gogojungle.co.jp/finance/navi/articles/93154
For the file names and titles of the PDFs to effectively utilize R1R2S2, please refer to the above Investment Navi+ article.
Below, we introduce examples of signals forR1R2S2.
AUD/JPY, 5-minute chart
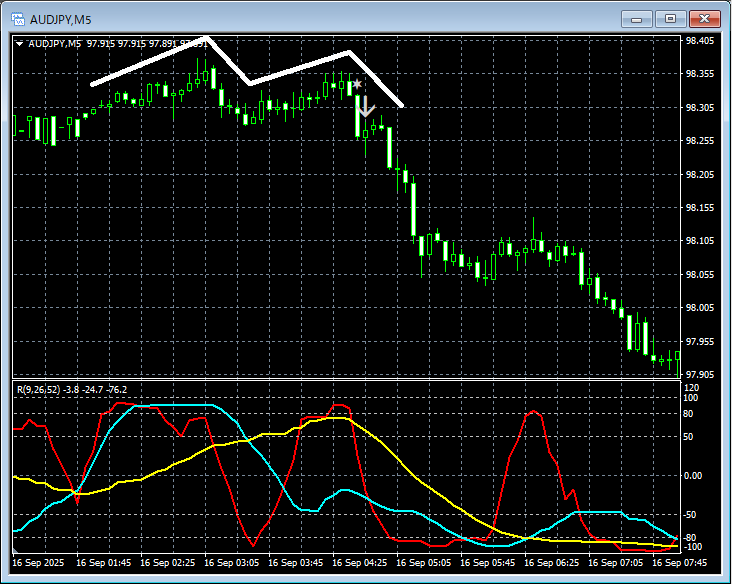
R1R2S2 signals
In the above chart,R1R2S2 signals light up at timely moments.
Waiting for a signal from mBDSR is a scenario,mBDSR signal did not light up or you missed it or were late,R1R2S2 signals can compensate,R1R2S2 is often used together withmBDSR.
Indicator that shines in combination with RCI【BODSOR・mBDSR】
Method & Case Studies (PDF) ★GogoJungle AWARD 2020 Winner★
https://www.gogojungle.co.jp/tools/indicators/11836
A PDF package with over 550 PDFs (Methods & Case Studies: over 1,950 pages, over 690,000 words) is included.
Most of these are designed to link higher and lower timeframes logically using the three RCI lines, and to progressively analyze multiple lower timeframes, ultimately waiting for a dipping buy or rally-selling timing (i.e., an mBDSR signal).
Also,there is a focus on capturing points where multiple entry reasons overlap.There are many such cases.
Also included is a method to explore upside and downside targets using three RCI lines.
In the PDF explanations,over 1,900 charts are used.

=================
Blacksun Indicators (List)
https://www.gogojungle.co.jp/finance/navi/articles/33779
=================


