

Solid and sturdy FX [Master RCI to win!!!] Sign of R1R2S2 USD/JPY 5-minute chart
========================================
[Solid Pattern] Signals of Reversion High, Fibonacci, RCI Oversold, and R1R2S2
USD/JPY 1-minute chart
https://www.gogojungle.co.jp/finance/navi/articles/97494
========================================
[Mastering RCI!! Trend Reversal, Buy on Dips, Sell on Rallies]
An indicator that shines in combination with RCI: [BODSOR, mBDSR]
and methodology/case studies (PDF) ★GogoJungle AWARD 2020 winner★
https://www.gogojungle.co.jp/tools/indicators/11836
R1R2S2is included in the above product. For details, please see the investment navigator+ article below.
RCI 3-line “2-stage determination” to target trend reversals, dips, and rallies with the indicator “R1R2S2” released!!
※The above product [BODSOR・mBDSR] includes, in addition to the standard method and case studies, 358 PDFs (over 1,400 pages, over 1,350 chart pages, over 470,000 words).
※Separately from the PDFs above, there are 31 PDFs (methods and case studies: over 120 pages, over 115 chart pages, over 40,000 words) to effectively utilize R1R2S2.
PDF collection to effectively utilize R1R2S2 [Master RCI!!]
https://www.gogojungle.co.jp/finance/navi/articles/93154
For the file names and titles of the PDFs to effectively utilize R1R2S2, please see the above investment navigator+ article.
Below, we introduce examples of signals forR1R2S2.
USD/JPY 5-minute chart
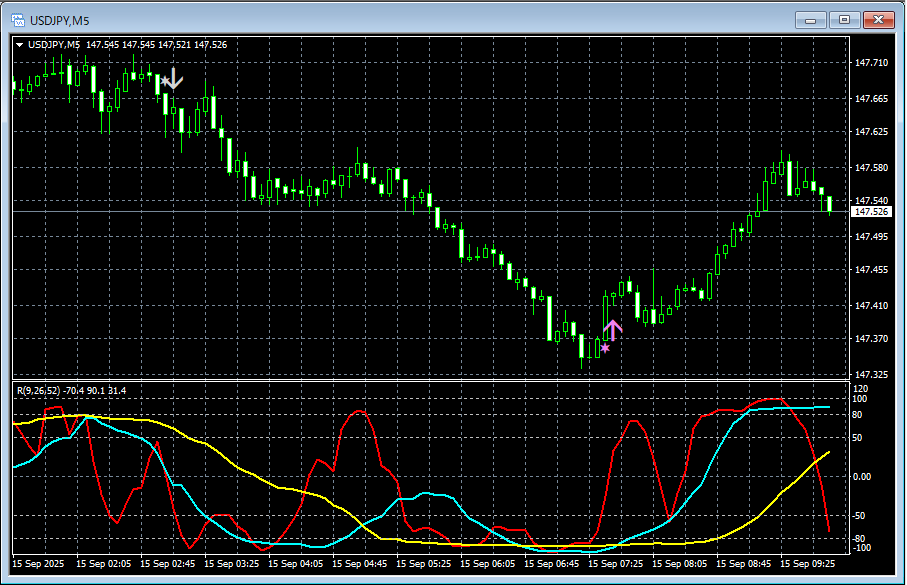
R1R2S2signals
In the chart above,R1R2S2 signalslight up at timely moments.
Waiting for mBDSR signals,mBDSR signalsdid not light up or were missed or late,R1R2S2 signalscan sometimes be used to respond,R1R2S2ismBDSRand is often used in conjunction with it.
An indicator that shines when combined with RCI: [BODSOR, mBDSR]
and methodology/case studies (PDF) ★GogoJungle AWARD 2020 winner★
https://www.gogojungle.co.jp/tools/indicators/11836
Includes more than 550 PDFs (methods and case studies: over 1,950 pages, over 690,000 words).
Most of them are aimed atexplaining via RCI’s 3-line setup how to logically link higher and lower timeframes, sequentially analyze multiple lower-timeframe conditions, and ultimately wait for dips or rallies on the lower timeframe (i.e., mBDSR signals).as a summarized approach.
Additionally,many of them emphasize identifying points where multiple entry bases overlap..
Note thatthe method to explore upside or downside targets using RCI’s 3-line setupis also included.
In the PDF explanations,over 1,900 chartsare used.

========================================
Blacksun’s Indicator List
https://www.gogojungle.co.jp/finance/navi/articles/33779
========================================


