

Solid and sturdy FX [Master RCI and win with a moving average filter!! AUDJPY 1-minute chart] sign of mBDSR
=================
【RCI Related】Free Indicators and Free eBooks from Blacksun
https://www.gogojungle.co.jp/finance/navi/articles/90181
=================
【Master RCI!! Trend Reversal, Buy on Dips, Sell on Rallies】
Indicators that shine when used in combination with RCI【BODSOR・mBDSR】
and methods・case studies (PDF) ★GogoJungle AWARD2020 win★
https://www.gogojungle.co.jp/tools/indicators/11836
※This product【BODSOR・mBDSR】includes, as before, 358 PDFs (over 1,400 pages in total, over 1,350 chart pages, over 470,000 characters) as part of the methods and case studies.
mBDSR (RCI Filter)andmBDSR (Moving Average Filter)have different roles. The differences in usage are also described in the included PDF.
mBDSR (Moving Average Filter)For the file name and title of the PDF that explains this, please refer to the article below on Investment Navi+.
【Master RCI and Win!!】Summary of PDFs Explaining mBDSR (Moving Average Filter)
https://www.gogojungle.co.jp/finance/navi/articles/90127
Below, we introduce examples of signals formBDSR (Moving Average Filter)signals.
AUDUSD / AUDJPY 1-minute chart
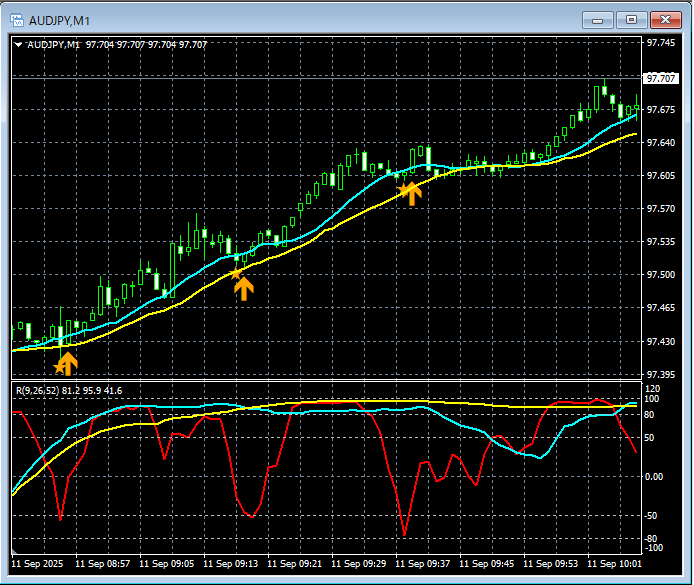
In the chart above,mBDSR (Moving Average Filter)signals light up at well-timed moments.
In the case of the Moving Average Filter mBDSRas well,you can achieve high-probability trades by combining with the higher-timeframe down to lower-timeframe embedding using the 3-line RCIand this is also explained in the included PDF.
※ The charts shown in this article may have added circles, lines, or rectangles for ease of explanation, please understand.
Indicators that shine when used in combination with RCI【BODSOR・mBDSR】
and methods・case studies (PDF) ★GogoJungle AWARD2020 win★
https://www.gogojungle.co.jp/tools/indicators/11836
More than 550 PDF files (methods & case studies: over 1,950 pages in total, over 690,000 characters).
Most of them are aboutlinking higher and lower timeframes logically using the RCI 3-line setup, then sequentially examining multiple lower timeframes, and ultimately waiting for a dip-buy or pullback-sell timing (i.e., mBDSR signals) on the lower timeframe..
In addition,many emphasize catching points where multiple entry reasons overlap.There are also many examples.
Furthermore,the method to explore upside potential or downside targets using RCI is included..
In the PDF explanations,over 1,900 charts are used..

=================
Blacksun Indicators (List)
https://www.gogojungle.co.jp/finance/navi/articles/33779
=================


