

Dollar-Yen 1-minute chart signals: RCI three lines, double bottom, mBDSR, and R1R2S2
=================
【RCI Related】Blacksun's Free Indicators and Free eBooks
https://www.gogojungle.co.jp/finance/navi/articles/90181
=================
【Master RCI!! Trend Reversal, Buy on Dips, Sell on Rallies】
Indicators that shine in combination with RCI【BODSOR・mBDSR】
and Techniques & Case Studies (PDF) ★GogoJungle AWARD 2020 Winner★
https://www.gogojungle.co.jp/tools/indicators/11836
R1R2S2is included in the above products. For details, please read the article below on the Investment Navigator+.
RCI 3-line “Two-step Confirmation” to Target Trends, Buy on Dips, and Sell on Rallies – R1R2S2 Released!!
※This product【BODSOR・mBDSR】includes 358 PDFs as techniques & case studies (Total over 1,400 pages, over 1,350 charts, over 470,000 words).
※In addition to the above PDFs, 31 PDFs (Techniques & Case Studies: over 120 pages, over 115 charts, over 40,000 words) are included to effectively use R1R2S2.
PDF Collection for Effectively Using R1R2S2【Master RCI to Win!!】
https://www.gogojungle.co.jp/finance/navi/articles/93154
R1R2S2For information on the file names and titles of the PDFs to effectively use, please refer to the above Investment Navigator+ article.
Below,mBDSR (RCI Two-Filter)andR1R2S2will be shown simultaneously as examples.
USD/JPY 1-minute chart
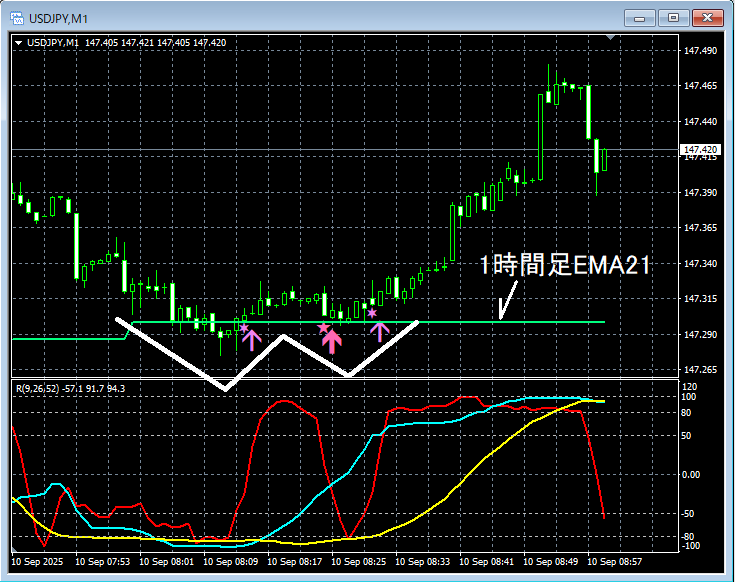
mBDSR(RCI two-filter)andR1R2S2signals
In the above chart,near the EMA21 on the 1-hour chartadouble bottomis forming and rising. In the rebound process,the signals of mBDSR (two RCI filters) and R1R2S2light up in a timely manner.
RCI Three-Lineis used to drill down from higher timeframes to lower timeframes,waiting for signals of mBDSRto light up, andif the mBDSR signal does not light up, or if a signal is missed or late,there are cases where theR1R2S2 signalcan be used,R1R2S2isoften used in conjunction withmBDSR.
Indicators that shine in combination with RCI【BODSOR・mBDSR】
and Techniques & Case Studies (PDF) ★GogoJungle AWARD 2020 Winner★
https://www.gogojungle.co.jp/tools/indicators/11836
Over 550 PDF files (Techniques & Case Studies: over 1,950 pages, over 690,000 words) are included.
Most of them aresummaries of examples that logically link higher and lower timeframes using the RCI 3-line, and finally wait for buy-the-dip or sell-on-rally timings (the mBDSR signal) on the lower timeframes.
In addition,many resources focus on identifying points where multiple entry reasons overlap.
Additionally,there are methods that explore upside and downside targets using the RCI 3-line..
In the PDF explanations,more than 1,900 chartsare used.

=================
Blacksun Indicators (List)
https://www.gogojungle.co.jp/finance/navi/articles/33779
=================


