

【RCI3 Three-Line + mBDSR】Dollar-Yen 30-minute chart pullback sell signal
0
BODSOR (mBDSR)The sales page forhere.
※ BODSOR and mBDSR are indicators developed to improve entry accuracy when using the RC I3-line to buy on the dip or sell on the rally.
They are indicators designed to enhance entry precision.
The figure below is a 30-minute chart of USD/JPY.
USD/JPY 30-minute chart (January 25, 2019)
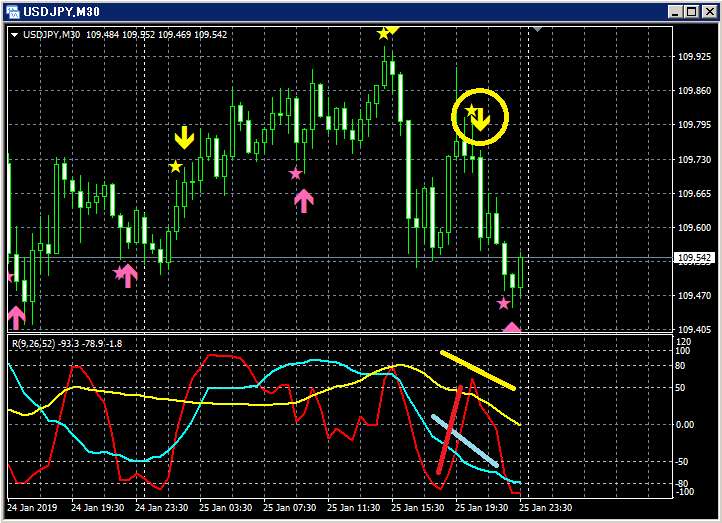
Upper layer: mBDSR
Among the three RCI lines, only RCI9 is clearly rising.
If RCI9 reverses and declines, all three RCIs may move downward together.
In other words, prices may experience a strong drop.
In such a situation, the mBDSR sell-on-rally signal (yellow arrow circled) lights up and appears
.
In this example, the sell-on-rally signal seems to capture the timing of the resumption of the decline well.
This can be considered reliable.
BODSOR (mBDSR) sales page is here.

Twitter
https://twitter.com/RCIX3Line
Blog
http://bodsor.blog.fc2.com/
Investing Navigator+
https://fx-on.com/navi/serial/?id=359
YouTube
https://www.youtube.com/channel/UCL-g5uAlesiWVJEDtWlFvGw
Examples of buy-the-dip and sell-on-rally signals on the USD/JPY 1-hour chart
※Please note that in the charts within this article, for convenience of explanation, circles, lines, and rectangles may have been drawn in.
Thank you for your understanding.
× ![]()


