

Digging to the bottom, FX mBDSR (RCI2 two-filter) utilizes both the signs of R1R2S2 and the signal (50) Gold XAUUSD 15-minute chart
=================
【RCI Related】 Blacksun’s Free Indicators and Free E-books
https://www.gogojungle.co.jp/finance/navi/articles/90181
=================
【Mastering RCI!! Trend Reversal, Buy-the-Dip, and Sell-the-Rally】
Indicators that excel when combined with RCI: 【BODSOR・mBDSR】
and Methods & Case Studies (PDF) ★GogoJungle AWARD2020 Winner★
https://www.gogojungle.co.jp/tools/indicators/11836
R1R2S2is included in the above products. For details, please see the article below in the Investment Navigator+.
RCI Three-Line “Two-Stage Judgment” to Target Trend Reversal, Buy-the-Dip, and Sell-the-Rally: R1R2S2 Release!!
※This product【BODSOR・mBDSR】includes, from the previous, 358 PDFs (total over 1,400 pages, over 1,350 chart pages, over 470,000 characters) as part of its methods and case studies.
※In addition to the above PDFs, there are 31 PDFs (methods & case studies: over 120 pages, over 115 charts, over 40,000 characters) that help effectively utilize R1R2S2.
PDF Collection for Effectively Utilizing R1R2S2【Master RCI!!】
https://www.gogojungle.co.jp/finance/navi/articles/93154
R1R2S2For the file names and titles of the PDFs to effectively use it, please refer to the above Investment Navigator+ article.
Below, we introducemBDSR (RCI Two-Root Filter)andR1R2S2signs shown simultaneously.
Gold / US Dollar XAUUSD 15-minute chart
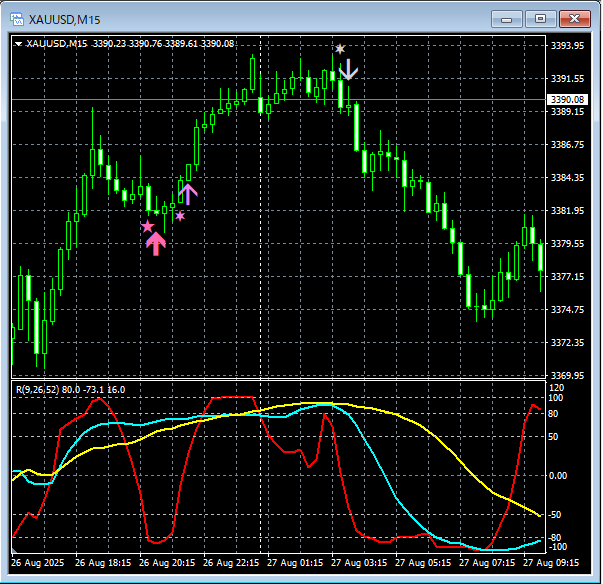
mBDSR (RCI Two-Root Filter)andR1R2S2signs
On the above chart,signs from mBDSR (RCI Two-Root Filter) and R1R2S2light up in a timely manner.
RCI Three-Lineis used to cascade from higher to lower timeframes,waiting for mBDSR’s signto illuminate, andif the mBDSR signdoes not illuminate, or if you miss or lag the sign,the R1R2S2 signmay be used to respond,andR1R2S2often used in conjunction with
Indicators that excel when combined with RCI: 【BODSOR・mBDSR】
and Methods & Case Studies (PDF) ★GogoJungle AWARD2020 Winner★
https://www.gogojungle.co.jp/tools/indicators/11836
There are over 550 PDF files included (Methods & Case Studies: total over 1,950 pages, over 690,000 characters).
Many of them are about logically linking higher and lower timeframes using the RCI Three-Line to consider multiple lower-timeframe conditions step by step, ultimately waiting for the lower timeframe timing (the mBDSR sign) to buy on dips or sell on rallies.
In addition,there is a strong emphasis on capturing points where multiple entry reasons align.There are many such examples.
Also included is a method for exploring upward or downward targets using the RCI Three-Line.
In the PDF explanations,more than 1,900 chartsare used.

=================
Blacksun Indicators (List)
https://www.gogojungle.co.jp/finance/navi/articles/33779
=================
× ![]()


