

Solid and sturdy FX [Master RCI to win extremely!!] R1 R2 S2 Sign GBPCAD Daily Chart
0
=================================
【RCI related】Blacksun's free indicators and free eBooks
https://www.gogojungle.co.jp/finance/navi/articles/90181
=================================
【Mastering RCI!! Trend Reversal, Buy the Dip, Sell the Rally】
Indicators that shine in combination with RCI【BODSOR・mBDSR】
and techniques & case studies (PDF) ★GogoJungle AWARD2020 winner★
https://www.gogojungle.co.jp/tools/indicators/11836
R1R2S2is included in the above product. For details, please read the article below on the Investment Navi+ site.
RCI 3-line “two-stage confirmation” to target trend reversals, dips, and rallies with the indicator “R1R2S2” released!!
※This product【BODSOR・mBDSR】comes with a traditional PDF pack of 358 items (total over 1,400 pages, over 1,350 charts, over 470,000 kanji characters) as materials for techniques and case studies.
※In addition, apart from the PDFs above, there are 31 PDFs (techniques & case studies: over 120 pages, over 115 charts, over 40,000 characters) to effectively utilize R1R2S2.
PDF collection to effectively utilize R1R2S2【Master RCI and Win!!】
https://www.gogojungle.co.jp/finance/navi/articles/93154
Please refer to the Investment Navi+ article above for the file names and titles of the PDFs to effectively utilize R1R2S2.
Below, we introduce examples of signals forR1R2S2.
GBP/CAD – Daily chart
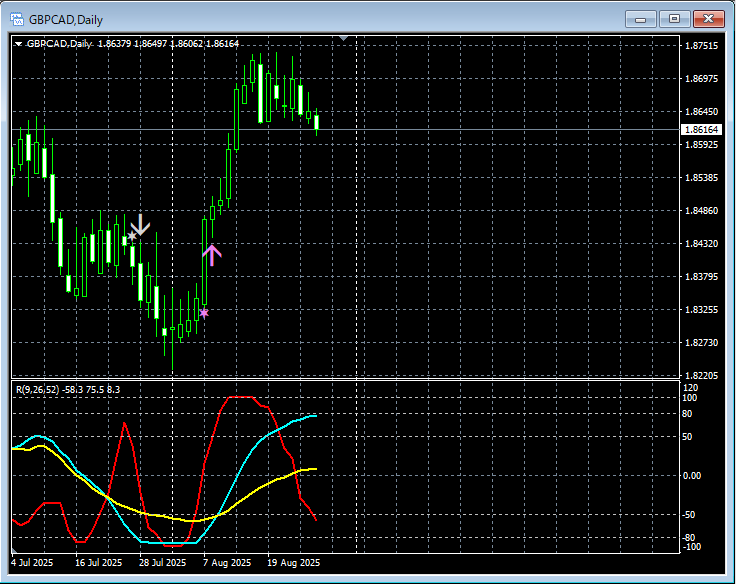
R1R2S2signal
In the chart above,R1R2S2 signallights up at the right timing.
Waiting for the mBDSR signal,mBDSR signaldid not light up or was missed or delayed,R1R2S2 signalcan be used to respond, andR1R2S2is often used in conjunction withmBDSR.
Indicators that shine in combination with RCI【BODSOR・mBDSR】
and techniques & case studies (PDF) ★GogoJungle AWARD2020 winner★
https://www.gogojungle.co.jp/tools/indicators/11836
Includes over 550 PDF files (techniques & case studies: over 1,950 pages, over 690,000 characters).
Most of them are examples that lay out a method of logically linking multiple higher-timeframe and lower-timeframe using the RCI 3-line, ultimately waiting for the timing of dips or rallies on the lower timeframes (i.e., the mBDSR signal).
Also,many of them focus on capturing points where multiple entry reasons coincide..
In addition,there are also methods to explore upside and downside targets using the RCI 3-line..
In the PDF explanations,over 1,900 charts are used..

=================================
Blacksun Indicators (List)
https://www.gogojungle.co.jp/finance/navi/articles/33779
=================================
× ![]()


