

Digging to the bottom: Using both the sign of FX mBDSR (RCI2 two filters) and the sign of R1R2S2 (46) GBPUSD 4-hour chart
========================================
【RCI Related】 Blacksun's Free Indicators and Free E-Books
https://www.gogojungle.co.jp/finance/navi/articles/90181
========================================
【Mastering RCI!! Trend Reversal, Buy the Dip, Sell on Retracements】
Indicators that work in conjunction with RCI: 【BODSOR・mBDSR】
and Methods / Case Studies (PDF) ★GogoJungle AWARD2020 Winner★
https://www.gogojungle.co.jp/tools/indicators/11836
R1R2S2is included in the above product. For details, please read the article below on Investment Navi+.
*This product 【BODSOR・mBDSR】 comes with 358 PDFs (totaling over 1,400 pages, over 1,350 chart pages, more than 470,000 characters) as methods and case studies from the past.
*In addition to the above PDFs, there are 31 PDFs (Methods & Case Studies: over 120 pages, over 115 charts, more than 40,000 characters) to effectively utilize R1R2S2.
PDF Collection to Effectively Utilize R1R2S2【Master RCI to Win!!】
https://www.gogojungle.co.jp/finance/navi/articles/93154
R1R2S2For the file names and titles of the PDFs to effectively utilize R1R2S2, please refer to the above Investment Navi+ article.
Below,mBDSR (RCI two-filter)andR1R2S2will be shown with their signals displayed simultaneously.
GBPUSD – 4-hour chart
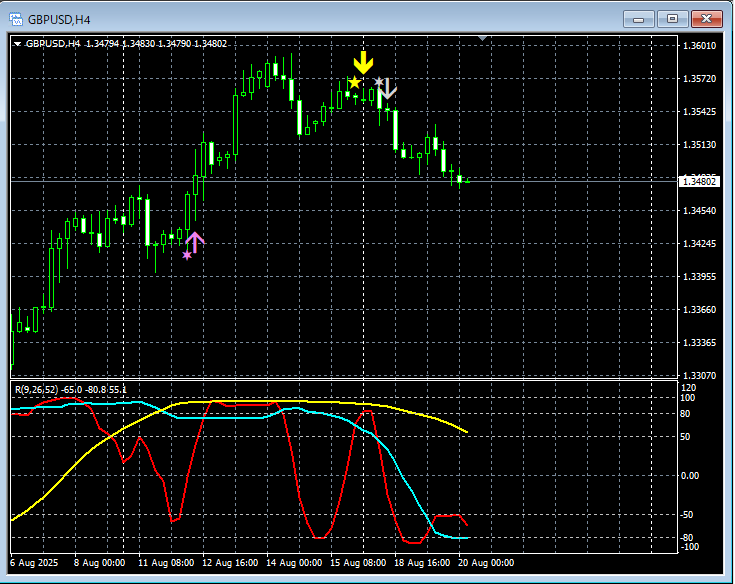
mBDSR (RCI two-filter)andR1R2S2signals
In the above chart,signals of mBDSR (RCI two-filter) and R1R2S2light up in a timely manner.
Using the 3-line RCIto drill down from higher to lower timeframes,wait for mBDSR signalsto light up,if mBDSR signals do not light up, or if you miss or are late,there are cases whereR1R2S2 signalscan be used, andR1R2S2mBDSRis often used in conjunction with.
An indicator that shines when combined with RCI: 【BODSOR・mBDSR】
and Methods / Case Studies (PDF) ★GogoJungle AWARD2020 Winner★
https://www.gogojungle.co.jp/tools/indicators/11836
Includes over 550 PDFs (Methods & Case Studies: totaling over 1,950 pages, over 690,000 characters).
Most of them arecases where you logically link higher and lower timeframes using the RCI 3-line, examine multiple lower-timeframe situations step by step, and ultimately wait for dip buying or retracement timing (i.e., mBDSR signals) on the lower timeframes..
Also,many focus on identifying points where multiple entry reasons coincide..
Additionally,there are methods that explore upward or downward targets using the three-line RCI..
In the PDFs,over 1,900 chartsare used.

========================================
Blacksun Indicators (List)
https://www.gogojungle.co.jp/finance/navi/articles/33779
========================================
× ![]()


