

Solid and robust FX【Master RCI and win with moving average filter!! Dow Jones US30 30-minute chart】mBDSR’s pullback sell signal
0
==============================================
【RCI Related】 Blacksun's Free Indicators and Free E-Books
https://www.gogojungle.co.jp/finance/navi/articles/90181
==============================================
【Mastering RCI!! Trend Reversal, Buy the Dip, and Sell the Rally】
Indicators that shine when combined with RCI【BODSOR・mBDSR】
and Techniques & Case Studies (PDF) ★GogoJungle AWARD2020 Winner★
https://www.gogojungle.co.jp/tools/indicators/11836
※This product【BODSOR・mBDSR】comes with a large amount of accompanying material: 358 PDFs (over 1,400 pages, over 1,350 chart pages, over 470,000 words).
mBDSR (RCI Filter) and mBDSR (Moving Average Filter) have different roles. The accompanying PDF also explains how to use them in a complementary manner.
mBDSR (Moving Average Filter) For the PDF file name and title that explain it, please see the Investment Navi+ article below.
【Mastering RCI and Winning!!】 Summary of PDFs Explaining mBDSR (Moving Average Filter)
https://www.gogojungle.co.jp/finance/navi/articles/90127
Below, we introduce examples of signals formBDSR (Moving Average Filter).
Dow Jones Average US30 30-minute chart
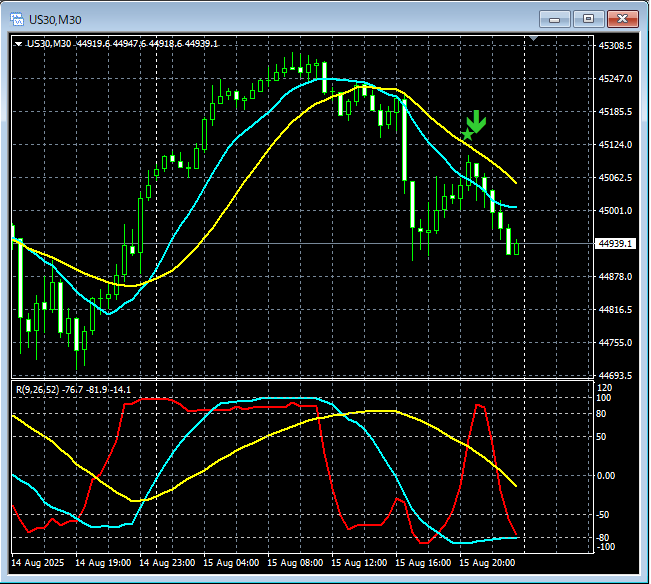
On the 30-minute chart above,mBDSR (Moving Average Filter) sell signal for the pullback is lighting up at the right timing.
For the Moving Average Filter mBDSR,when used in conjunction with the higher-timeframe to lower-timeframe consolidation using the 3-line RCI, enables high-probability trades. This is also explained inthe accompanying PDF.
※ Note: In the charts shown in this article, for the sake of explanation, circles, lines, and rectangles may have been added.
The indicator that shines when combined with RCI【BODSOR・mBDSR】
and techniques & case studies (PDF) ★GogoJungle AWARD2020 Winner★
https://www.gogojungle.co.jp/tools/indicators/11836
Over 550 PDF files (techniques & case studies: over 1,950 pages, over 690,000 words) are included.
Many of these are designed to logically link higher and lower timeframes using the 3-line RCI, examining multiple lower timeframes sequentially, and ultimately waiting for pullbacks or rallies on the lower timeframes (i.e., signals of mBDSR).
Additionally,these materials place emphasis on identifying points where multiple entry reasons overlap.There are many such examples.
Also included is a method for exploring upward and downward targets using the RCI three-line approach.
In the PDF files, explanations useover 1,900 charts..

==============================================
Blacksun Indicators (List)
https://www.gogojungle.co.jp/finance/navi/articles/33779
==============================================
× ![]()


