

Sturdy and Robust FX [Mastering RCI to Win with a Moving Average Filter!!] EURNZD From Yesterday's 15-minute Chart
===============================
【RCI Related】 Blacksun's Free Indicators and Free E-Books
https://www.gogojungle.co.jp/finance/navi/articles/90181
===============================
【Master RCI!! Trend Reversal, Buy on Dips, Sell on Rallies】
Indicators that demonstrate power when used with RCI: 【BODSOR・mBDSR】
and Methods & Case Studies (PDF) ★GogoJungle AWARD 2020 Winner★
https://www.gogojungle.co.jp/tools/indicators/11836
※This product【BODSOR・mBDSR】includes, since the conventional, 358 PDFs of methods and case studies (total over 1,400 pages, over 1,350 charts, over 470,000 characters).
mBDSR (RCI Filter)andmBDSR (Moving Average Filter)serve different roles. The usage distinctions are also discussed in the accompanying PDF.
mBDSR (Moving Average Filter)For the PDF that explains it, please see the file name and title in the following Investment Navi+ article.
【Master RCI and Win!!】Summary of PDFs that explain mBDSR (Moving Average Filter)
https://www.gogojungle.co.jp/finance/navi/articles/90127
Below, we introduce examples of signals formBDSR (Moving Average Filter)signals.
Euro/NZ Dollar EURNZD 15-minute chart
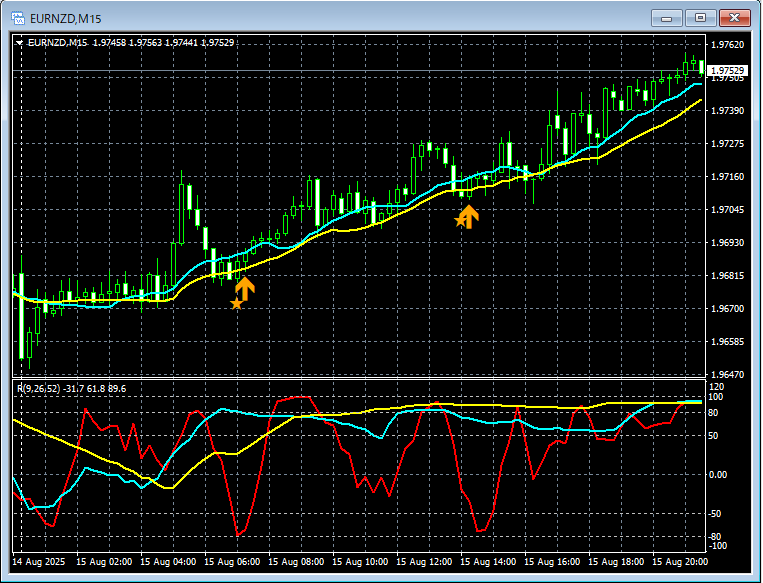
In the 15-minute chart above,mBDSR (Moving Average Filter)buy-the-dip signals light up at timely points.
In the moving average filter mBDSRcase as well,When used in conjunction with the higher-timeframe RCI three-line layout (top-down).It enables high-probability trades. This is also explained in theAccompanying PDF.
※Please note that in the charts presented in this article, for convenience of explanation, circles, lines, and rectangles may be drawn.
Indicators that are powerful when combined with RCI: 【BODSOR・mBDSR】
and Methods & Case Studies (PDF) ★GogoJungle AWARD 2020 Winner★
https://www.gogojungle.co.jp/tools/indicators/11836
More than 550 PDFs (Methods & Case Studies: total over 1,950 pages, over 690,000 characters) are included.
Many of these areexamples where logical links are drawn between higher and lower timeframes using the three-line RCI to sequentially consider the status of multiple lower timeframes, ultimately waiting for lower-timeframe signals to buy on dips or sell on rallies (i.e., the mBDSR signals)..
Additionally,there are many that focus on identifying points where multiple entry reasons overlap..
Also,there are methods to explore upward and downward targets using RCI three-line layout..
In the PDF explanations,.

===============================
Blacksun's Indicators (List)
https://www.gogojungle.co.jp/finance/navi/articles/33779
===============================
× ![]()


