

Digging to the bottom, FX mBDSR (RCI2 two-filter) utilizing both the signs of R1R2S2 and the signs (44) Euro/AUD from yesterday's chart
0
==============================
【RCI Related】Free indicators and free eBooks from Blacksun
https://www.gogojungle.co.jp/finance/navi/articles/90181
==============================
【Mastering RCI!! Trend Reversal, Buy Dips, Sell Rallies】
Indicators that excel in combination with RCI【BODSOR・mBDSR】
and methods / case studies (PDF) ★GogoJungle AWARD2020 Winner★
https://www.gogojungle.co.jp/tools/indicators/11836
R1R2S2is included in the above product. For details, please read the article below in Investor Navi+.
RCI 3-line 'Two-stage Judgment' to target trend reversals, dip buys, and rallies: R1R2S2 released!!
※This product【BODSOR・mBDSR】includes, in addition to the traditional methods and case studies, 358 PDFs (over 1,400 pages, over 1,350 chart pages, over 470,000 characters).
※In addition to the PDFs above, 31 PDFs (methods & case studies: over 120 pages, over 115 charts, over 40,000 characters) are included to effectively utilize R1R2S2.
PDF Collection to Effectively Use R1R2S2【Master RCI!!】
https://www.gogojungle.co.jp/finance/navi/articles/93154
R1R2S2For details on the file names and titles of the PDFs to effectively utilize, please refer to the above Investor Navi+ article.
Below,mBDSR (RCI two-clip filter)andR1R2S2signs are shown simultaneously as an example.
EUR/USD Aussie? Euro-Australia? EURAUD One-hour chart
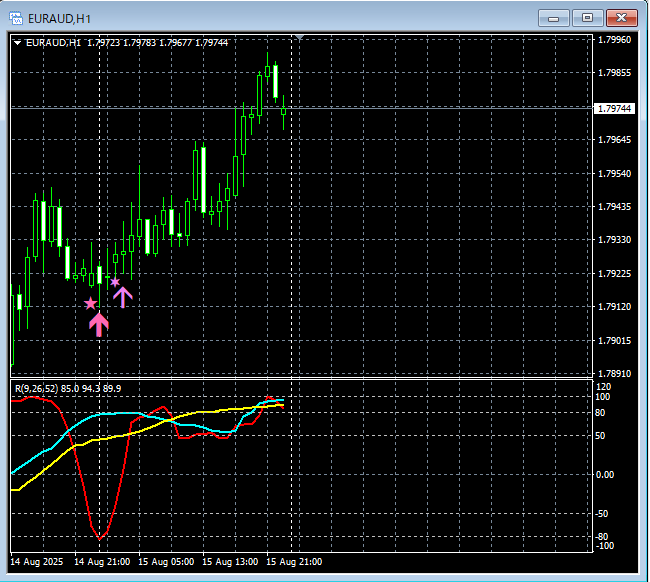
mBDSR (RCI two-clip filter)andR1R2S2signs
On the above one-hour chart,mBDSR (RCI two-filter) dip-buy signal→R1R2S2 dip-buy signallights up in a timely sequence.
Using the RCI three-lineto filter from higher to lower timeframes,wait for the signal of mBDSRto illuminate,when the mBDSR signaldoes not illuminate, or if the signal is missed or late,the signal of R1R2S2may be used to respond,R1R2S2isoften used together withmBDSRwith
Indicators that excel in combination with RCI【BODSOR・mBDSR】
and methods / case studies (PDF) ★GogoJungle AWARD2020 Winner★
https://www.gogojungle.co.jp/tools/indicators/11836
Includes over 550 PDF files (methods & case studies: over 1,950 pages, over 690,000 characters).
Many of these areexamples that describe logically linking higher and lower timeframes using the RCI three-line, then considering multiple lower-timeframe conditions step by step, ultimately waiting for a dip-buy or rally timing (the mBDSR signal) on the lower timeframe..
Also,many emphasize identifying points where multiple entry reasons coincide..
Additionally,there are methods to explore upside and downside targets using the RCI three-line as well..
In the PDF explanations,over 1,900 chartsare used.

==============================
Blacksun Indicators (List)
https://www.gogojungle.co.jp/finance/navi/articles/33779
==============================
× ![]()


