

Substance and Robust FX 【Master RCI to Win!!】 Sign of R1R2S2 USD/JPY 1-hour chart from the latest chart
════════════════════════════════
【RCI Related】Free indicators and free e-books from Blacksun
https://www.gogojungle.co.jp/finance/navi/articles/90181
════════════════════════════════
【Mastering RCI!! Trend reversal, dip buying, and pullback selling】
Indicators that shine in combination with RCI【BODSOR・mBDSR】
and methods & case studies (PDF) ★GogoJungle AWARD2020 winner★
https://www.gogojungle.co.jp/tools/indicators/11836
R1R2S2is included in the above products. For details, please read the article below in the Investment Navi+.
RCI 3-line “Two-stage Confirmation” to target trend reversals, dip buying, and pullbacks with the indicator “R1R2S2” released!!
※This product【BODSOR・mBDSR】includes, in addition to the above, 358 PDFs (total over 1,400 pages, over 1,350 chart pages, over 470,000 words) as methods and case studies from the past.
※In addition to the PDFs above, 31 PDFs (methods and case studies: over 120 pages, over 115 charts, over 40,000 words) are included to effectively utilize R1R2S2.
PDF collection to effectively use R1R2S2【Master RCI and Win!!】
https://www.gogojungle.co.jp/finance/navi/articles/93154
Please refer to the Investment Navi+ article above for the file names and titles of the PDFs to effectively utilize R1R2S2.
Below, we introduce examples of signals forR1R2S2.
USD/JPY, 1-hour chart
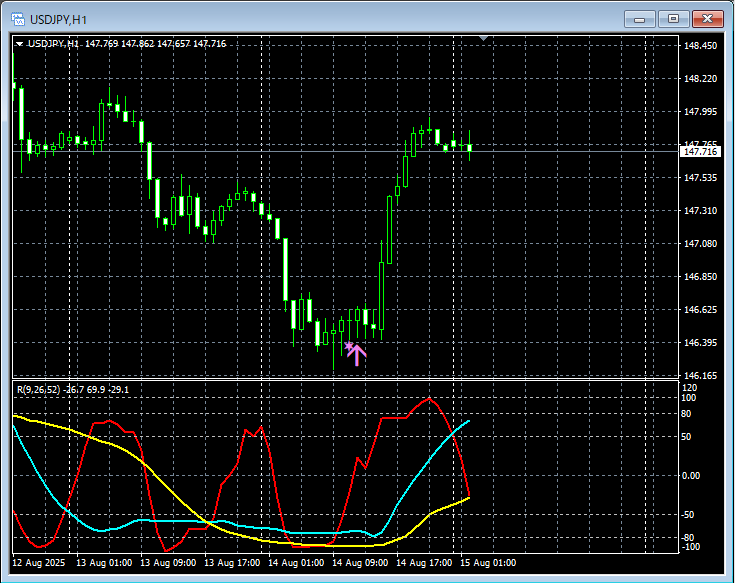
R1R2S2signals
On the above 1-hour chart,the dip-buying signal of R1R2S2lights up at the right timing.
Waiting for the mBDSR signal,the mBDSR signaldoes not light up or you missed it or were late to catch it,R1R2S2 signalcan sometimes be used to respond,R1R2S2isoften used together withmBDSR
Indicators that shine when combined with RCI【BODSOR・mBDSR】
and methods & case studies (PDF) ★GogoJungle AWARD2020 winner★
https://www.gogojungle.co.jp/tools/indicators/11836
Includes over 550 PDF files (methods & case studies: over 1,950 pages, over 690,000 words).
Most of them aresummaries of how to logically link higher and lower timeframes using the RCI 3-line, iterating through multiple lower timeframes, and ultimately waiting for the dip-buying or pullback-selling timing (the mBDSR signal) on the lower timeframes.
In addition,there are many that emphasize capturing points where multiple entry reasons converge.
Also included are techniques to explore upward and downward targets using the RCI 3-line.
In the PDF explanations,more than 1,900 chartsare used.

════════════════════════════════
Blacksun Indicators (List)
https://www.gogojungle.co.jp/finance/navi/articles/33779
════════════════════════════════
× ![]()


