

Sturdy and robust FX [Master RCI and win with moving average filter!! USD/JPY 5-minute chart] Counter-trend line and mBDSR pullback buying signal
0
=================
【RCI Related】 Free indicators and free e-books from Blacksun
https://www.gogojungle.co.jp/finance/navi/articles/90181
=================
【Mastering RCI!! Trend Reversal, Buy on Dips, Sell on Rallies】
Indicators that excel when used with RCI【BODSOR・mBDSR】
and methods & case studies (PDF) ★GogoJungle AWARD2020 winner★
https://www.gogojungle.co.jp/tools/indicators/11836
※This product【BODSOR・mBDSR】includes, as before, 358 PDFs (total over 1,400 pages, over 1,350 chart sheets, over 470,000 characters) as part of the methods and case studies.
mBDSR (RCI filter)andmBDSR (Moving Average Filter)have different roles. The distinction is also covered in the included PDF.
mBDSR (Moving Average Filter)For the file name and title of the PDF that contains explanations, please see the article below on Investment Navigation+.
【Mastering RCI to Win!!】Summary of PDFs that explain mBDSR (Moving Average Filter)
https://www.gogojungle.co.jp/finance/navi/articles/90127
Below, we introduce examples of signals formBDSR (Moving Average Filter).
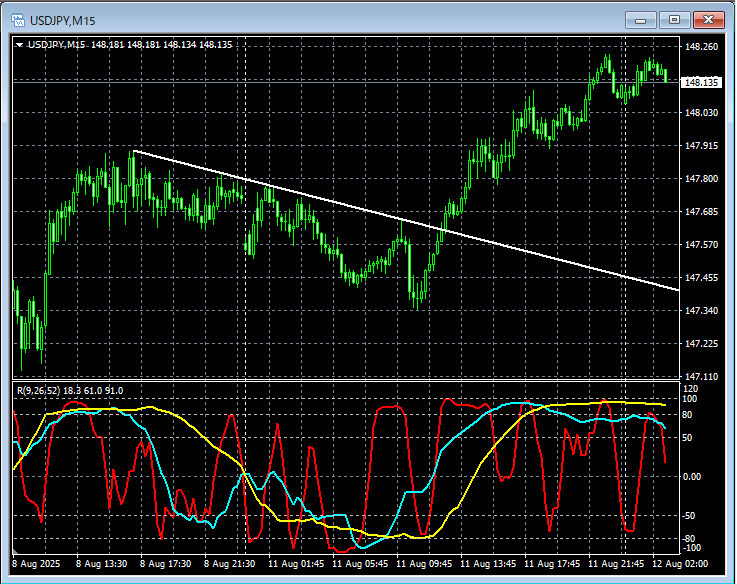
USD/JPY 15-minute chart
USD/JPY 5-minute chart
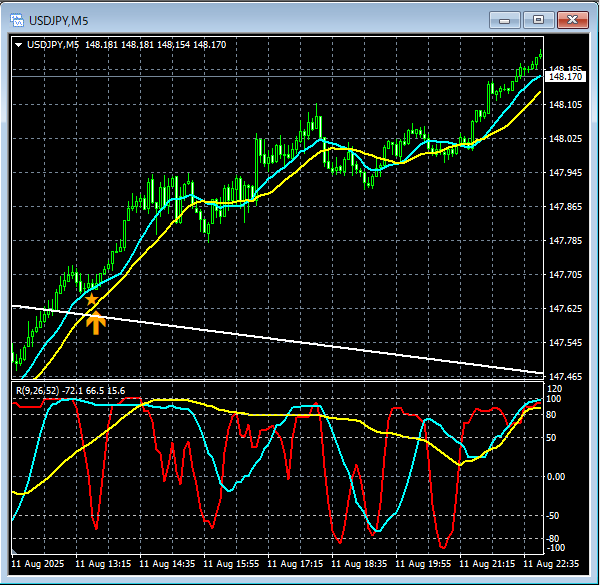
In the above 5-minute chart,Counter-trend linebreakout and the subsequent pullback,mBDSR (Moving Average Filter)buy-the-dip signals light up at the right timing.
In the case of the Moving Average Filter mBDSRalsowhen used in conjunction with the higher-timeframe pull-down using three RCI lines, trading with a high edge becomes possible. The PDF included explains this as well.
※ Please note that, for convenience of explanation, charts in this article may include circles, lines, rectangles, etc.
Indicator that shines when combined with RCI【BODSOR・mBDSR】
and methods & case studies (PDF) ★GogoJungle AWARD2020 winner★
https://www.gogojungle.co.jp/tools/indicators/11836
Includes over 550 PDF files (methods & case studies: total over 1,950 pages, over 690,000 characters).
Many of these areexamples that logically link higher-timeframe and lower-timeframe by using three RCI lines, sequentially considering multiple lower-timeframe conditions, and ultimately waiting for a dip-buy or pullback timing on the lower timeframe (i.e., the signals from mBDSR)..
Furthermore,these include many that focus on capturing points where multiple entry reasons overlap..
Also included is a method to explore upside and downside targets using RCI’s three-line method.
In the PDF explanations,over 1,900 chartsare used.

=================
Blacksun Indicators (List)
https://www.gogojungle.co.jp/finance/navi/articles/33779
=================
× ![]()


