

Solid and robust FX [Master RCI to win extremely!!] R1 R2 S2 signals USD/JPY 15-minute chart
0
===========================================
【RCI Related】Blacksun Free Indicators and Free E-Books
https://www.gogojungle.co.jp/finance/navi/articles/90181
===========================================
【Mastering RCI!! Trend Reversal・Dip Buying・Pullback Selling】
Indicators that excel in combination with RCI【BODSOR・mBDSR】
Methods and case studies (PDF) ★GogoJungle AWARD 2020 Winner★
https://www.gogojungle.co.jp/tools/indicators/11836
R1R2S2is included in the above products. For details, please see the article below in Investment Navi+.
RCI 3-line “Two-step Judgment” to target trend reversals・dip buying・pullback selling: Indicator “R1R2S2” released!!
※This product【BODSOR・mBDSR】comes with a traditional 358 PDFs (over 1,400 pages, over 1,350 chart sheets, over 470,000 words) as part of the methods and case studies.
※In addition to the PDFs above, there are 31 PDFs (methods and case studies: over 120 pages, over 115 chart sheets, over 40,000 words) to effectively utilize R1R2S2.
PDF Collection for Effectively Utilizing R1R2S2【Master RCI and Win!!】
https://www.gogojungle.co.jp/finance/navi/articles/93154
Please refer to the Investment Navi+ article above for the file names and titles of the PDFs to effectively utilize R1R2S2.
Below, we introduce examples of signals forR1R2S2signals.
USDJPY – 15-minute chart
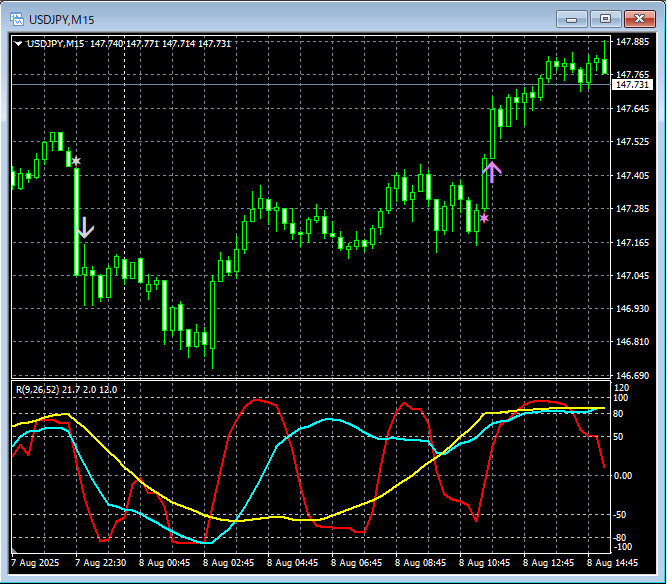
R1R2S2signals
On the 15-minute chart above,the pullback selling signal and dip buying signalfrom R1R2S2 light up at the right timing.
Waiting for the mBDSR signal,the mBDSR signaldoes not light up, or you miss or are late to see it,the R1R2S2 signalcan sometimes be used instead,R1R2S2is often used in conjunction withmBDSR.
Indicators that are powerful in combination with RCI【BODSOR・mBDSR】
and their methods and case studies (PDF) ★GogoJungle AWARD 2020 Winner★
https://www.gogojungle.co.jp/tools/indicators/11836
Over 550 PDF files (methods and case studies: over 1,950 pages, over 690,000 words) are included.
Many of these areexamples that explain logically linking higher and lower timeframes using the RCI Three-Line, sequentially considering the conditions of multiple lower timeframes, and ultimately waiting for a dip buy or pullback timing (the mBDSR signal) on the lower timeframe.
Also,many are focused on identifying points where multiple entry reasons converge.
Additionally,there are methods to explore upside and downside targets using the RCI three-line.
In the PDF explanations,there are over 1,900 charts used..

===========================================
Blacksun Indicators (List)
https://www.gogojungle.co.jp/finance/navi/articles/33779
===========================================
× ![]()


