

Substance and ruggedness FX 【Mastering RCI to win!!】 Sign of R1R2S2 Eurodollar 4-hour chart
===============================================
【RCI Related】 Blacksun Free Indicator and Free eBooks
https://www.gogojungle.co.jp/finance/navi/articles/90181
===============================================
【Mastering RCI!! Trend Reversal, Buy on Dips, Sell on Rallies】
Indicators that shine when used with RCI【BODSOR・mBDSR】
and Techniques & Case Studies (PDF) ★GogoJungle AWARD2020 Winner★
https://www.gogojungle.co.jp/tools/indicators/11836
R1R2S2is included in the above products. For details, please see the article below in the Investment Navi+.
RCI 3-line “Two-stage Confirmation” to Target Trend Reversal, Buy on Dips, and Sell on Rallies: R1R2S2 Released!!
※ This product【BODSOR・mBDSR】includes, as before, 358 PDFs (Total over 1,400 pages, over 1,350 chart pages, over 470,000 words) as part of the Techniques & Case Studies.
※ In addition to the above PDFs, there are 31 PDFs (Techniques & Case Studies: over 120 pages in total, over 115 charts, over 40,000 words) to effectively utilize R1R2S2.
PDF Collection to Effectively Use R1R2S2【Master RCI!! 】
https://www.gogojungle.co.jp/finance/navi/articles/93154
For the file names and titles of the PDFs to effectively utilize R1R2S2, please see the article above in the Investment Navi+.
Below, we introduce examples of signals forR1R2S2.
EUR/USD 4-hour chart
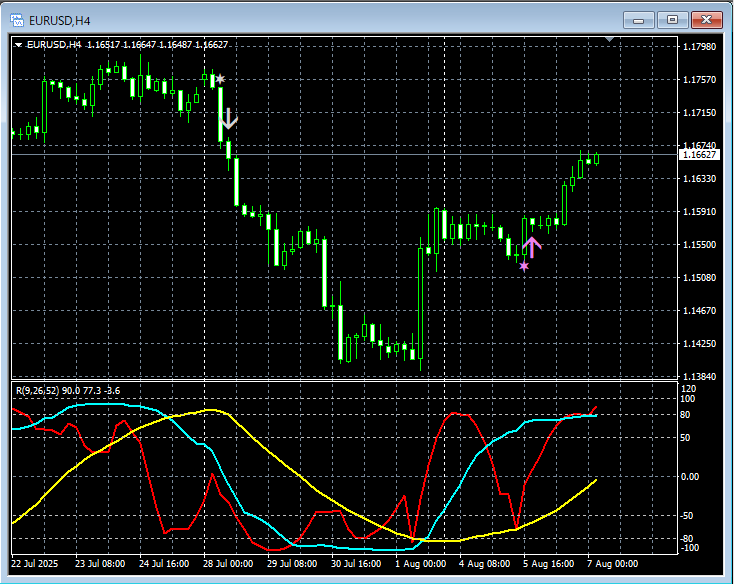
R1R2S2Signal
On the 4-hour chart above,the sell-on-rally and buy-on-dip signals of R1R2S2 light up in a timely manner.
Wait for the mBDSR signal, and if themBDSR signaldoes not light up, or you miss or are late to see it,R1R2S2 signalsmay be used to respond, andR1R2S2is often used in conjunction withmBDSR.
Indicators that shine when combined with RCI【BODSOR・mBDSR】
and Techniques & Case Studies (PDF) ★GogoJungle AWARD2020 Winner★
https://www.gogojungle.co.jp/tools/indicators/11836
Includes over 550 PDF files (Techniques & Case Studies: over 1,950 pages, over 690,000 words).
Most of them are structured as examples that link multiple higher- and lower-timeframe charts logically using the 3-line RCI, and ultimately wait for a timing to buy on dips or sell on rallies on the lower timeframe (the mBDSR signal).
Additionally,there are many that focus on capturing points where multiple entry criteria overlap..
Also included are methods to explore upside targets and downside targets using the RCI 3-line method.
In the PDF explanations,over 1,900 chartsare used.

===============================================
Blacksun Indicators (List)
https://www.gogojungle.co.jp/finance/navi/articles/33779
===============================================
× ![]()


