

[Master RCI to win in US employment data!!] Sign of R1R2S2 USDCAD 5-minute chart
========================================
【RCI Related】 Free indicators and free eBooks from Blacksun
https://www.gogojungle.co.jp/finance/navi/articles/90181
========================================
【Mastering RCI!! Trend Reversal, Buy on Dips, Sell on Rallies】
Indicators that work in combination with RCI【BODSOR・mBDSR】
and methods・case studies (PDF) ★GogoJungle AWARD2020
https://www.gogojungle.co.jp/tools/indicators/11836
R1R2S2is included in the above products. For details, please see the article below in 投資ナビ+ (Investment Navi Plus).
RCI 3-line “2-stage confirmation” to target trend reversals, buying on dips, and selling on rallies: the “R1R2S2” release!!
※This product【BODSOR・mBDSR】includes, as before, 358 PDFs (total over 1,400 pages, over 1,350 chart pages, over 470,000 words) as part of the methods and case studies.
※Besides the PDFs above, 31 PDFs (methods and case studies: over 120 pages, over 115 charts, over 40,000 words) are included to enable effective use of R1R2S2.
PDF collection to effectively use R1R2S2【Master RCI!!】
https://www.gogojungle.co.jp/finance/navi/articles/93154
For details on the file names and titles of the PDFs to effectively use R1R2S2, please see the article above in 投資ナビ+.
Below, on 2025 August 1st,U.S. Jobs Reportthe day of releaseR1R2S2signs will be introduced as examples.
US Dollar / Canadian Dollar USDCAD 5-minute chart
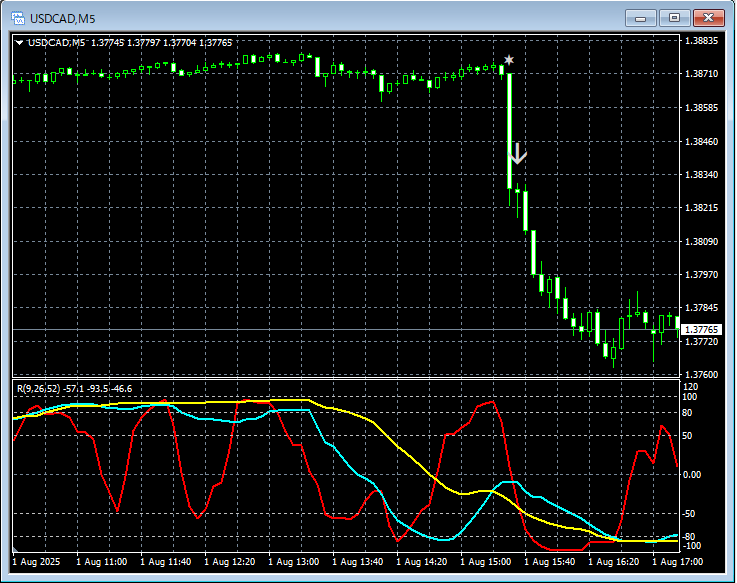
R1R2S2signals
On the above 5-minute chart, theR1R2S2’s Sell on Rally signalis lighting up at the right timing.
Waiting for the mBDSR signalon the scene,when the mBDSR signaldoes not light up, or you miss the signal or are late,R1R2S2 signalcan be used to respond,R1R2S2isoften used in conjunction withmBDSR.
Indicators that work powerfully with RCI: BODSOR・mBDSR
and methods・case studies (PDF) ★GogoJungle AWARD2020
https://www.gogojungle.co.jp/tools/indicators/11836
Includes over 550 PDF files (methods and case studies: total over 1,950 pages, over 690,000 words).
Many of these aresummaries of cases where RCI’s three lines logically link higher- and lower-timeframe perspectives to sequentially review multiple lower-timeframes, ultimately waiting for a dip-buy or rally-sell timing (the mBDSR signal)..
In addition,there are many that focus on capturing points where multiple entry reasons overlap..
Also included is a method for exploring upside and downside targets using the RCI three-line concept.
In the PDF explanations,more than 1,900 chartsare used.

========================================
Blacksun Indicators (List)
https://www.gogojungle.co.jp/finance/navi/articles/33779
========================================
× ![]()


