

【Master RCI to win with US employment statistics!!】 Sign of R1R2S2 Pound-Dollar 1-minute chart
0
=============
【RCI Related】Free Indicators by Blacksun and Free E-Books
https://www.gogojungle.co.jp/finance/navi/articles/90181
=============
【Mastering RCI!! Trend Reversals, Buy Dips, and Sell Rallies】
Indicators that excel when used with RCI【BODSOR・mBDSR】
and Methodology / Case Studies (PDF) ★Winner of GogoJungle AWARD 2020★
https://www.gogojungle.co.jp/tools/indicators/11836
R1R2S2is included in the above product. For details, please read the article below on Investment Navi+.
RCI 3-line “Two-Stage Confirmation” to Target Trend Reversals, Buy Dips, and Sell Rallies — R1R2S2 Release!!
※This product【BODSOR・mBDSR】comes with 358 PDFs (Total over 1,400 pages, over 1,350 chart pages, over 470,000 words) as part of the methodology and case studies.
※In addition to the above PDFs, there are 31 PDFs (Methods & Case Studies: 120+ pages, 115+ chart pages, over 40,000 words) included to effectively utilize R1R2S2.
PDF Collection to Effectively Use R1R2S2【Master RCI to Win!!】
https://www.gogojungle.co.jp/finance/navi/articles/93154
Please refer to the Investment Navi+ article above for the filenames and titles of the PDFs to effectively use R1R2S2.
Below, we introduce examples of signals after the U.S. Nonfarm Payrolls Release on August 1, 2025U.S. Employment ReportannouncementR1R2S2signals
GBPUSD 1-minute chart
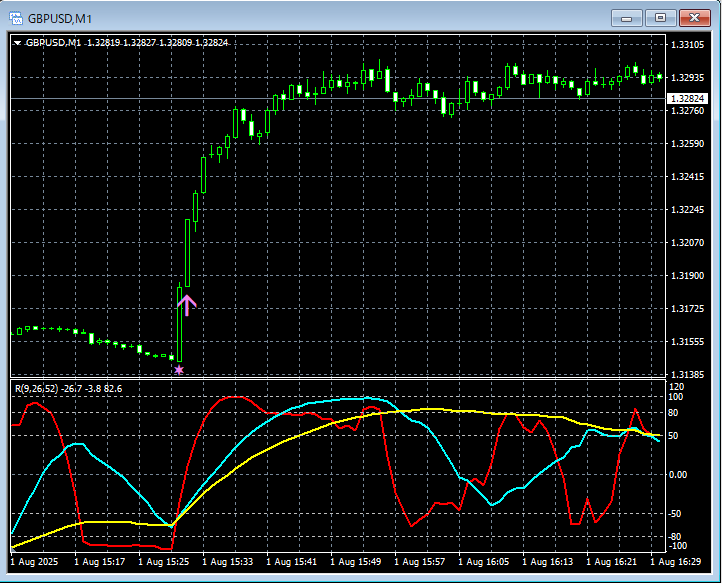
R1R2S2signals
In the 1-minute chart above,the Buy-the-Dip signal of R1R2S2 lights up at a good timing.
Waiting for the mBDSR signal,when the mBDSR signaldoes not light up, or you miss the signal or are late,the R1R2S2 signalmay be usable,andmBDSRR1R2S2isoften used in conjunction withto complement each other.
An indicator that shines when combined with RCI【BODSOR・mBDSR】
and Methodology / Case Studies (PDF) ★Winner of GogoJungle AWARD 2020★
https://www.gogojungle.co.jp/tools/indicators/11836
Includes over 550 PDFs (Methodology & Case Studies: total over 1,950 pages, over 690,000 words).
Many of these are designed to logically link higher and lower timeframes using the RCI 3-line approach, sequentially examining multiple lower-timeframe conditions, and eventually waiting for the dip buying or rally selling timing (the mBDSR signal) on the lower timeframe.
In addition,there are many that focus on identifying points where multiple entry reasons align.These are included.
Also included is a method to explore upside and downside targets using the RCI 3-line approach.
In the PDF explanations,over 1,900 chartsare used.

=================
Blacksun's Indicators (List)
https://www.gogojungle.co.jp/finance/navi/articles/33779
=================
× ![]()


