

[Master RCI to win using US employment data!!] The sign of R1R2S2 Euro Dollar 1-minute chart and 5-minute chart
=================
【RCI Related】Free indicators and free e-books for Blacksun
https://www.gogojungle.co.jp/finance/navi/articles/90181
=================
【Mastering RCI!! Trend Reversal, Buy the Dip, Sell the Rally】
Indicators that are powerful when combined with RCI【BODSOR・mBDSR】
and methods & case studies (PDF) ★GogoJungle AWARD2020 winner★
https://www.gogojungle.co.jp/tools/indicators/11836
R1R2S2is included in the above product. For details, please see the article below on Investment Navi+.
RCI 3-line “two-stage confirmation” indicator to target trend reversals, dip-buying, and rally selling: “R1R2S2” released!!
※This product【BODSOR・mBDSR】comes with, in addition to the standard, 358 PDFs (total over 1,400 pages, over 1,350 charts, over 470,000 characters) as a method and case study.
※Beyond the PDFs above, there are 31 PDFs (methods & case studies: over 120 pages, over 115 charts, over 40,000 characters) included to effectively use R1R2S2.
PDF collection to effectively use R1R2S2【Master RCI and Win!!】
https://www.gogojungle.co.jp/finance/navi/articles/93154
For the file names and titles of the PDFs to effectively use R1R2S2, please see the above Investment Navi+ article.
Below, examples of signals after the U.S. Non-Farm Payrolls release on August 1, 2025U.S. Employment Situation (Non-Farm Payrolls)after the releaseR1R2S2signals
Euro-Dollar EURUSD 1-minute chart
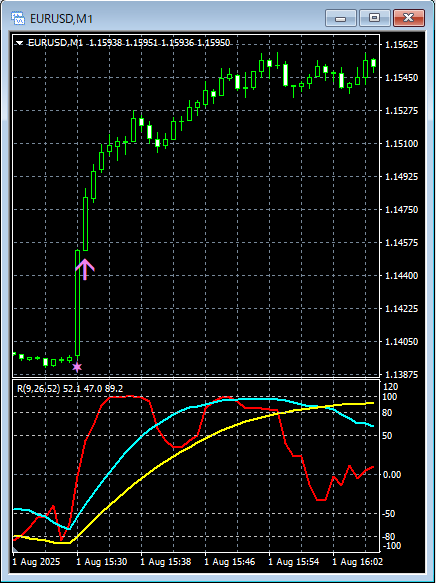
R1R2S2signals
Euro-Dollar EURUSD 5-minute chart
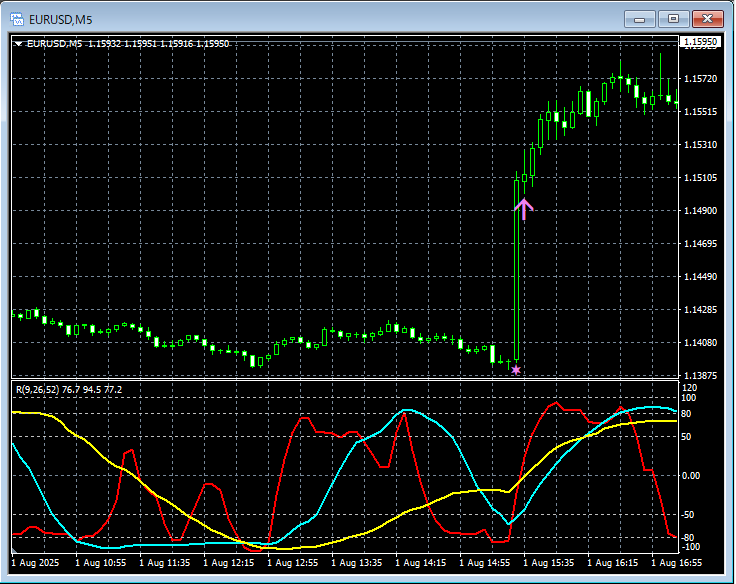
R1R2S2signals
On the 1-minute and 5-minute charts above,R1R2S2 dip-buying signalslight up in timely fashion.
When waiting for mBDSR signals,the mBDSR signalmay not light up, or you may miss it or be late, in which caseR1R2S2 signalscan sometimes be used to respond, andR1R2S2is often usedin conjunction withmBDSR.
Indicators that shine when combined with RCI【BODSOR・mBDSR】
and methods & case studies (PDF) ★GogoJungle AWARD2020 winner★
https://www.gogojungle.co.jp/tools/indicators/11836
More than 550 PDFs (methods & case studies: over 1,950 pages, over 690,000 characters) are included.
Many of these are examples that detail how to logically link higher and lower timeframes using the RCI 3-line, sequentially evaluating multiple lower-timeframe conditions, and ultimately waiting for a dip-buying or rally-selling timing (i.e., mBDSR signal) on the lower timeframe.
Additionally,there are many that focus on capturing points where multiple entry reasons align..
Also,there are methods to explore upside targets or downside targets using the RCI 3-line..
In the PDF materials,over 1,900 chartsare used.

=================
Blacksun Indicators (List)
https://www.gogojungle.co.jp/finance/navi/articles/33779
=================
× ![]()


