

[Master RCI to win by US employment statistics!!] Sign of R1R2S2 AUD/JPY 15-minute chart
================================================================
【RCI-Related】Free BlackSun indicators and free e-books
https://www.gogojungle.co.jp/finance/navi/articles/90181
================================================================
【Mastering RCI!! Trend Reversal, Buy on Dips, Sell on Rebounds】
Indicators that shine in combination with RCI【BODSOR・mBDSR】
and methods & case studies (PDF) ★GogoJungle AWARD2020 winner★
https://www.gogojungle.co.jp/tools/indicators/11836
R1R2S2is included in the above products. For details, please see the article below in the Investment Navi+.
RCI 3-line “2-stage confirmation” to target trend reversals, dips, and retracements – R1R2S2 released!!
※This product【BODSOR・mBDSR】comes with 358 PDFs as methods & case studies (total over 1,400 pages, over 1,350 chart pages, over 470,000 words).
※In addition to the PDFs above, 31 PDFs (methods & case studies: total over 120 pages, over 115 charts, over 40,000 words) are included to effectively utilize R1R2S2.
PDF collection to effectively utilize R1R2S2【Master RCI to Win!!】
https://www.gogojungle.co.jp/finance/navi/articles/93154
Please refer to the above Investment Navi+ article for the file names and titles of the PDFs to effectively utilize R1R2S2.
Below, examples of signals after the August 1, 2025 U.S. employment report are shown.U.S. Non-Farm PayrollsAnnouncementR1R2S2signals
AUD/JPY 15-minute chart
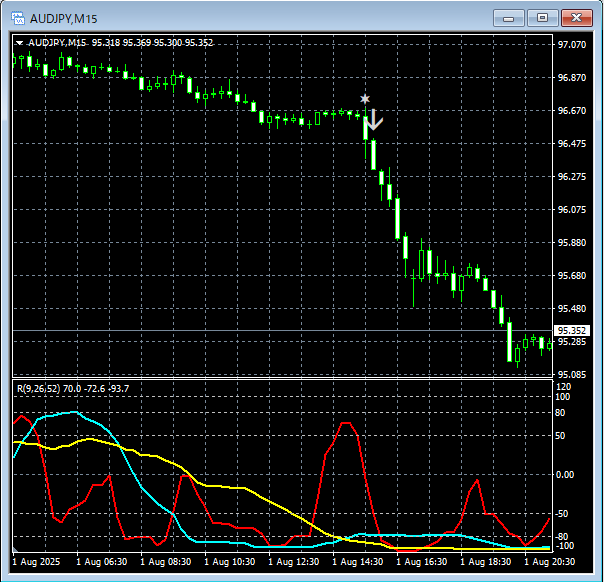
R1R2S2signal
In the above 15-minute chart,the R1R2S2 retrace-sell signalis lighting up at the right timing.
Wait for the mBDSR signal,the mBDSR signaldid not light up or was missed or lagged,R1R2S2 signalR1R2S2isoften used in conjunction withmBDSR.
Indicators that shine in combination with RCI【BODSOR・mBDSR】
and methods & case studies (PDF) ★GogoJungle AWARD2020 winner★
https://www.gogojungle.co.jp/tools/indicators/11836
Includes more than 550 PDF files (methods & case studies: over 1,950 pages, over 690,000 words).
Many of these aresummaries of how to logically link higher and lower timeframes using the RCI 3-line, then progressively examine multiple lower timeframes, ultimately waiting for a dip-buy or retracement timing (the mBDSR signal).This is the overall approach.
Also,many entries focus on capturing points where multiple entry reasons overlap.There are also many.
Additionally,there are methods that explore upside and downside targets using the RCI 3-line..
In the PDF explanations,over 1,900 chartsare used.

================================================================
Blacksun Indicators (List)
https://www.gogojungle.co.jp/finance/navi/articles/33779
================================================================
× ![]()


