

Getting to the bottom of FX【RCI mastered and win with moving average filter!! USD/CHF 15-minute chart】mBDSR’s dip-buy signal
===============================
【RCI Related】 Blacksun's Free Indicators and Free E-Books
https://www.gogojungle.co.jp/finance/navi/articles/90181
===============================
【Mastering RCI!! Trend Reversal • Buy on Dips • Sell on Rallies】
Indicators that pair with RCI to unleash power【BODSOR・mBDSR】
and methods & case studies (PDF) ★GogoJungle AWARD2020 winner★
https://www.gogojungle.co.jp/tools/indicators/11836
※This product【BODSOR・mBDSR】includes, as standard, 358 PDFs (over 1,400 pages, over 1,350 chart pages, over 470,000 characters) as method and case studies.
mBDSR (RCI Filter)andmBDSR (Moving Average Filter)serve different roles. The usage distinctions are also covered in the attached PDF.
mBDSR (Moving Average Filter)For the PDF that explains it, see the file name and title in the article below on Investment Navi+.
【Master RCI and Win!!】Summary of PDFs that explain mBDSR (Moving Average Filter)
https://www.gogojungle.co.jp/finance/navi/articles/90127
Below, we will introduce examples of signals formBDSR (Moving Average Filter)signals.
USDCHF (Dollar/Swiss) 15-minute chart
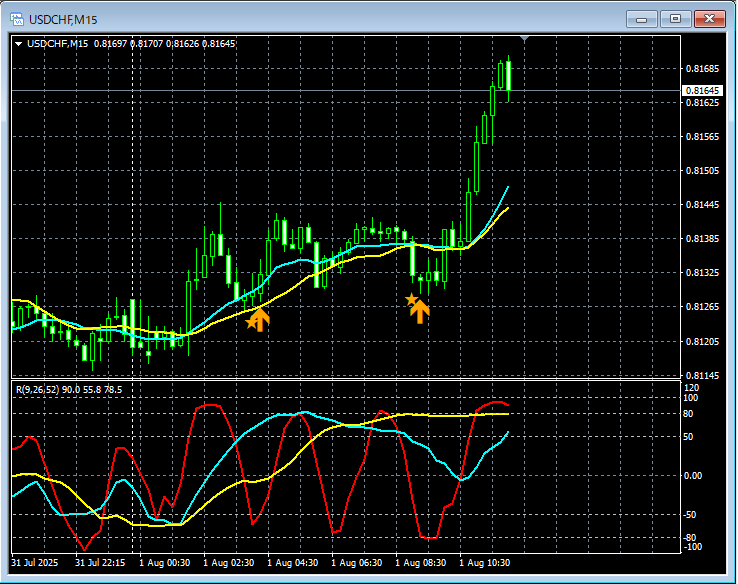
In the 15-minute chart above,the pullback-buy signal of mBDSR (Moving Average Filter)fires at a timely moment.
In the case of the Moving Average Filter mBDSRas well,when used in conjunction with the higher time frame leading into the lower time frame using the three RCI linesit enables high-probability trades. This is also explained in theattached PDF.
※Please note that the charts shown in this article may include circles, lines, or rectangles for readability.
Indicators that pair with RCI to unleash power【BODSOR・mBDSR】
and methods & case studies (PDF) ★GogoJungle AWARD2020 winner★
https://www.gogojungle.co.jp/tools/indicators/11836
Over 550 PDFs included (methods & case studies: over 1,950 pages, over 690,000 characters).
Many of theseexplain how to logically link higher and lower time frames using the three RCI lines, examining multiple lower time frame conditions step by step, and finally waiting for pullbacks or rallies on the lower time frame signals of mBDSR..
Additionally,many focus on identifying points where multiple entry reasons overlap..
Furthermore,there are also methods for exploring ascent and descent targets using three RCI lines..
In the PDF explanations,are used.

===============================
Blacksun’s Indicators (List)
https://www.gogojungle.co.jp/finance/navi/articles/33779
===============================
× ![]()


