

【Master RCI and move averages filter to win!! EUR/USD 15-minute chart】mBDSR’s pullback sell signal
0
========================================
【RCI Related】 Free indicators and free e-books for Blacksun
https://www.gogojungle.co.jp/finance/navi/articles/90181
========================================
【Master RCI!! Trend reversal・Buy-the-dip・Sell-on-rally】
Indicator that shines when used in combination with RCI【BODSOR・mBDSR】
and methods & case studies (PDF) ★GogoJungle AWARD2020 winner★
https://www.gogojungle.co.jp/tools/indicators/11836
※This product【BODSOR・mBDSR】comes bundled with 358 PDFs (over 1,400 pages in total, over 1,350 chart images, and over 470,000 words).
mBDSR (RCI Filter)andmBDSR (Moving Average Filter)have different roles. The accompanying PDF also discusses how to differentiate their use.
mBDSR (Moving Average Filter)For the file name and title of the PDF that explains this, please see the following Investor Navi+ article.
【Master RCI and Win!!】Summary of PDFs explaining mBDSR (Moving Average Filter)
https://www.gogojungle.co.jp/finance/navi/articles/90127
Below,mBDSR (Moving Average Filter)signal examples are shown.
Euro Dollar 15-minute chart
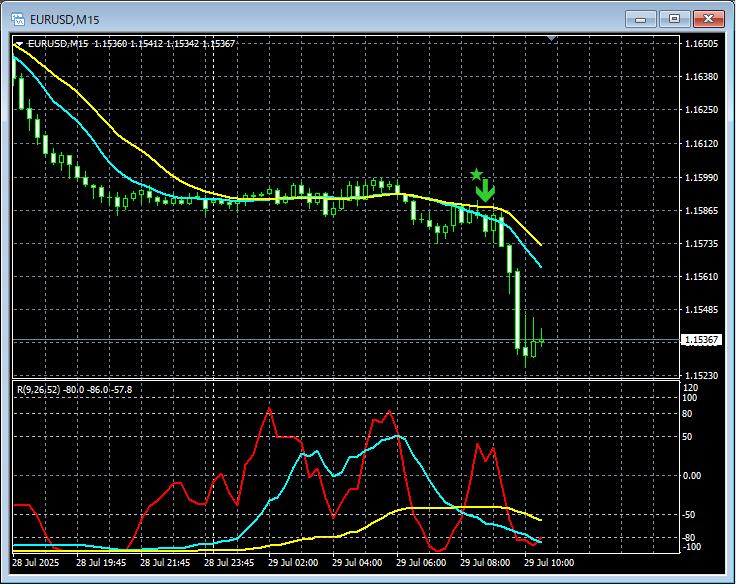
In the above 15-minute chart,mBDSR (Moving Average Filter)sell-reversal signals light up at the right timing.
When using Moving Average Filter in mBDSRas well,by layering with the higher-timeframe to lower-timeframe consolidation using the 3-line RCIyou can conduct high-probability trades. This is also explained in the attached PDF.
※ Some charts in this article may have added circles, lines, rectangles, etc. for ease of explanation, please understand.
Indicator that shines when used in combination with RCI【BODSOR・mBDSR】
and methods & case studies (PDF) ★GogoJungle AWARD2020 winner★
https://www.gogojungle.co.jp/tools/indicators/11836
The PDF files amount to 358 in total (over 1,400 pages, over 470,000 words).
Many of them areexamples that link higher-timeframe and lower-timeframe logically using the RCI three-line, examining multiple lower timeframes one after another, and ultimately waiting for the lower timeframe’s buy-the-dip or sell-into rally timing (the mBDSR signal)..
Additionally,there are many that focus on capturing points where multiple entry reasons overlap..
Note that,it also includes methods for exploring upside and downside targets using the RCI three-line..
In the PDF explanations,over 1,350 charts are used..

× ![]()


