

【Master RCI and conquer with a moving average filter!! JP225 1-hour chart】mBDSR pullback sell signal Nikkei Stock Average
0
==============================
【RCI Related】 Free Indicator and Free eBook about Blacksun
https://www.gogojungle.co.jp/finance/navi/articles/90181
==============================
【Mastering RCI!! Trend Reversal, Buy on Dips, Sell on Rallies】
Indicators that work powerfully in combination with RCI【BODSOR・mBDSR】
and methods / case studies (PDF) ★GogoJungle AWARD2020 Winner★
https://www.gogojungle.co.jp/tools/indicators/11836
※This product【BODSOR・mBDSR】includes, as methods and case studies, 358 PDFs (total over 1,400 pages, more than 1,350 chart pages, over 470,000 characters).
mBDSR (RCI Filter)andmBDSR (Moving Average Filter)have different roles. The accompanying PDF discusses how to use them different ways.
mBDSR (Moving Average Filter)For the file name and title of the PDFs that explain it, please refer to the article below in the Investment Navi+.
【Master RCI and Win!!】Summary of PDFs Explaining mBDSR (Moving Average Filter)
https://www.gogojungle.co.jp/finance/navi/articles/90127
Below, we introduce examples of signals formBDSR (Moving Average Filter)signals.
Nikkei Average JP225 1-Hour Chart
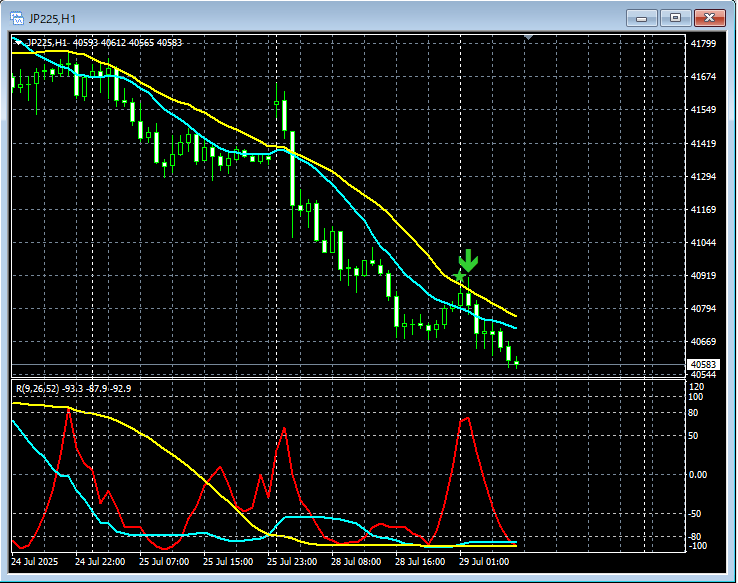
On the 1-hour chart above,mBDSR (Moving Average Filter)sell signals on pullbacks light up at timely points.
In the case of the Moving Average Filter mBDSRalsowhen used in conjunction with mapping from higher timeframes to lower timeframes using the three RCI linesit enables high-probability trades. This is also explained in theaccompanying PDF.
※Please note that in the charts mentioned in this article, for convenience of explanation, circles, straight lines, and squares may have been added.
Indicators that shine when combined with RCI【BODSOR・mBDSR】
and methods / case studies (PDF) ★GogoJungle AWARD2020 Winner★
https://www.gogojungle.co.jp/tools/indicators/11836
The PDF files amount to 358 total (over 1,400 pages, over 470,000 characters).
Many of them areexamples that logically link higher and lower timeframes using the three RCI lines, examine multiple sub-timeframe conditions sequentially, and ultimately wait for pullbacks or rallies on the lower timeframes (i.e., signals of mBDSR)..
Additionally,there are many that emphasize identifying points where multiple entry reasons coincide..
Also included is information on a method to explore rise and fall targets using the three RCI lines.
In the PDF explanations,over 1,350 chartsare used.

× ![]()


