

[Master RCI!!] Sign of Double Top and R1 R2 S2
0
========================================
【RCI Related】Free indicator and free e-book from Blacksun
https://www.gogojungle.co.jp/finance/navi/articles/90181
========================================
【Mastering RCI!! Trend Reversal, Buy-the-Dip, and Sell-the-Rally】
Indicator that shines when combined with RCI【BODSOR・mBDSR】
and methods / case studies (PDF) ★GogoJungle AWARD2020 Winner★
https://www.gogojungle.co.jp/tools/indicators/11836
R1R2S2is included in the above products. For details, please read the following Investment Navi+ article.
RCI 3-lines with a “two-stage decision” to aim for trend reversal, buy-the-dip, and sell-the-rally: R1R2S2 released!!
※The product【BODSOR・mBDSR】comes with, in addition to the above, 358 PDFs (total over 1,400 pages, more than 1,350 charts, over 470,000 characters) as methods and case studies.
※In addition to the above PDFs, there are 31 PDFs (methods & case studies: over 120 pages, more than 115 charts, over 40,000 characters) to effectively utilize R1R2S2.
PDF Collection to Effectively Utilize R1R2S2【Master RCI and Win!!】
https://www.gogojungle.co.jp/finance/navi/articles/93154
Please refer to the Investment Navi+ article above for the file names and titles of the PDFs to effectively utilize R1R2S2.
Below, we introduce examples of signs forR1R2S2.
GBP/CAD - 15-minute chart
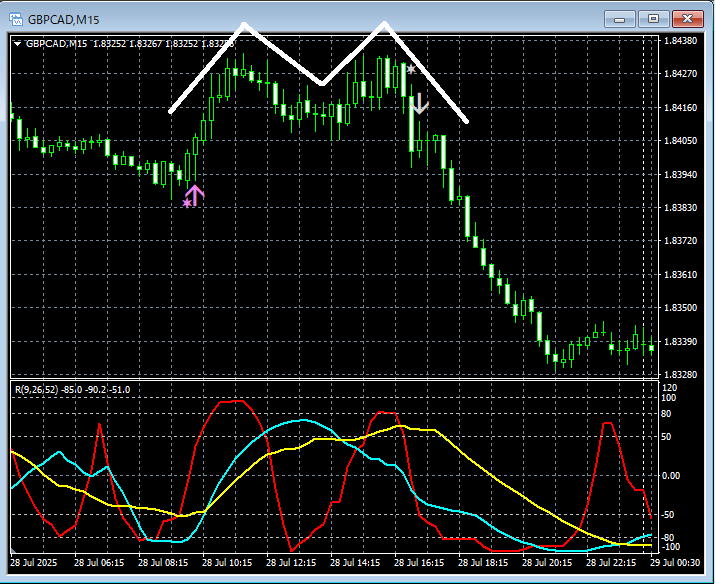
Sign ofR1R2S2
On the 15-minute chart above, the result isLeft side of a double top,Buy-the-dip sign of R1R2S2on the left, and on the rightSell-the-rally sign of R1R2S2timely lighting up.
Waiting for the mBDSR sign,If the mBDSR signdoes not light up, is missed, or delayed,R1R2S2 signcan sometimes be used to respond,R1R2S2isoften used together withmBDSR.
Indicator that shines in combination with RCI【BODSOR・mBDSR】
and methods / case studies (PDF) ★GogoJungle AWARD2020 Winner★
https://www.gogojungle.co.jp/tools/indicators/11836
Includes over 550 PDFs (methods & case studies: over 1,950 pages, over 690,000 characters).
Many of them are the form that logically links higher time frames and lower time frames using the RCI three-line approach, examines the multiple lower-time-frame situations sequentially, and ultimately waits for the timing of buy-the-dip or sell-the-rally on the lower time frame (i.e., the sign of mBDSR).
In addition,many focus on capturing points where multiple entry reasons overlap..
Also included is a method to explore upside and downside projections using the three-line RCI.
In the PDF explanations,over 1,900 chartsare used.

========================================
Blacksun Indicators (List)
https://www.gogojungle.co.jp/finance/navi/articles/33779
========================================
× ![]()


