

Utilize both the sign of mBDSR (RCI2 full filter) and the sign of R1R2S2 (41) Gold XAUUSD 5-minute chart
0
=================================
【RCI Related】 Blacksun's Free Indicators and Free E-Books
https://www.gogojungle.co.jp/finance/navi/articles/90181
=================================
【Mastering RCI!! Trend Reversal, Buy on Dip, Sell on Rally】
Indicators that excel in combination with RCI【BODSOR・mBDSR】
and Methods / Case Studies (PDF) ★Winner of GogoJungle AWARD2020★
https://www.gogojungle.co.jp/tools/indicators/11836
R1R2S2is included in the above product. For details, please read the article below in Investing Navi+.
RCI Three-Line “Two-Stage Confirmation” Indicator to Target Trend Reversals, Buy on Dip, and Sell on Rally: R1R2S2 Released!!
※The product【BODSOR・mBDSR】comes with, in addition to traditional methods and case studies, 358 PDFs (totaling over 1,400 pages, more than 1,350 chart pages, over 470,000 characters).
※In addition to the PDFs above, 31 PDFs (methods & case studies: over 120 pages, more than 115 chart pages, over 40,000 characters) are included to effectively utilize R1R2S2.
PDF Collection for Effectively Using R1R2S2【Master RCI to Win!!】
https://www.gogojungle.co.jp/finance/navi/articles/93154
R1R2S2For details on file names and titles of the PDFs to effectively use, please refer to the above Investing Navi+ article.
Below,mBDSR (RCI Two-Line Filter)andR1R2S2samples showing signals simultaneously are introduced.
Gold XAUUSD 5-minute chart
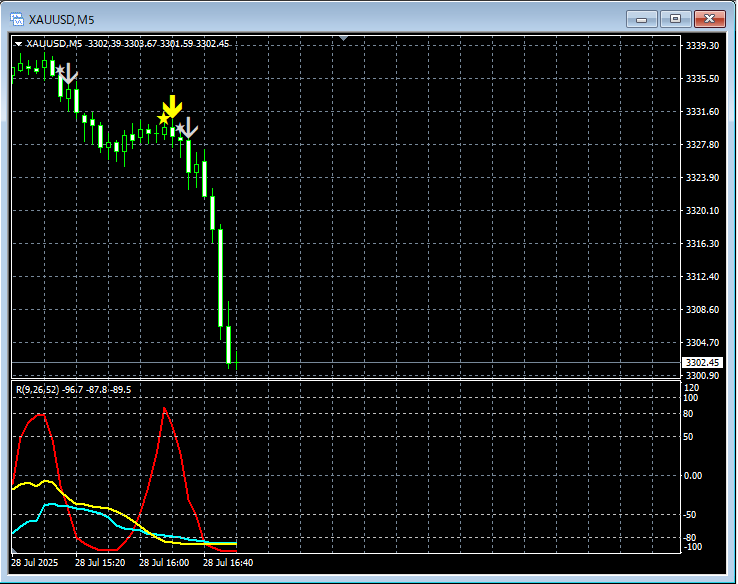
mBDSR (RCI Two-Line Filter)andR1R2S2
On the above 1-hour chart,R1R2S2 Sell-Back Signal→mBDSR (RCI Two-Line Filter) Sell-Back Signal→R1R2S2 Sell-Back Signallighting up in timely sequence.
Using the Three-Line RCIto drill down from higher to lower timeframes,Waiting for mBDSR signalsto illuminate,If the mBDSR signal does not light up or is missed or delayed,R1R2S2 signalscan be used in some cases, andR1R2S2is often usedin conjunction withmBDSR.Powerful in combination with RCI:【BODSOR・mBDSR】and methods & case studies (PDF) ★GogoJungle AWARD2020 Winner★https://www.gogojungle.co.jp/tools/indicators/11836Includes over 550 PDF files (Methods & Case Studies: total over 1,950 pages, over 690,000 characters).Most of which areexamples that logically link higher and lower timeframes by using the RCI Three-Line, then sequentially consider multiple lower timeframes, ultimately waiting for timing of dip buying or rally selling (i.e., mBDSR signals)..In addition,many focus on capturing points where multiple entry reasons overlap..Additionally,there are methods for exploring upside targets and downside targets using the RCI Three-Line as well..In the PDF explanations,over 1,900 charts are used..=================================Blacksun Indicators (List)https://www.gogojungle.co.jp/finance/navi/articles/33779=================================R1R2S2 signalscan be used in some cases, andR1R2S2is often usedin conjunction withmBDSR.
Powerful in combination with RCI:【BODSOR・mBDSR】
and methods & case studies (PDF) ★GogoJungle AWARD2020 Winner★
https://www.gogojungle.co.jp/tools/indicators/11836
Includes over 550 PDF files (Methods & Case Studies: total over 1,950 pages, over 690,000 characters).
Most of which areexamples that logically link higher and lower timeframes by using the RCI Three-Line, then sequentially consider multiple lower timeframes, ultimately waiting for timing of dip buying or rally selling (i.e., mBDSR signals)..
In addition,many focus on capturing points where multiple entry reasons overlap..
Additionally,there are methods for exploring upside targets and downside targets using the RCI Three-Line as well..
In the PDF explanations,over 1,900 charts are used..

=================================
Blacksun Indicators (List)
https://www.gogojungle.co.jp/finance/navi/articles/33779
=================================
× ![]()


