

[Master RCI with a moving average filter to win!! NZDCAD 5-minute chart] MBDSR rebound-selling signal
========================================
【RCI Related】 Free Indicator and Free eBooks for Blacksun
https://www.gogojungle.co.jp/finance/navi/articles/90181
========================================
【Mastering RCI!! Trend Reversal, Buy-the-Dip, and Sell-the-Rally】
Indicators that pair effectively with RCI【BODSOR・mBDSR】
and Methods・Case Studies (PDF) ★GogoJungle AWARD 2020 Winner★
https://www.gogojungle.co.jp/tools/indicators/11836
※This product【BODSOR・mBDSR】includes, as methods and case studies, 358 PDFs (over 1,400 pages, over 1,350 chart pages, over 470,000 words).
mBDSR (RCI Filter)andmBDSR (Moving Average Filter)serve different roles. The distinction is explained in the attached PDF as well.
mBDSR (Moving Average Filter)For the PDFs that explain it, please see the file names and titles in the article below on Invest Navi+.
【Master RCI and Win!!】Summary of PDFs Explaining mBDSR (Moving Average Filter)
https://www.gogojungle.co.jp/finance/navi/articles/90127
BelowmBDSR (Moving Average Filter)signal examples.
Kiwi Canada NZDCAD 5-minute chart
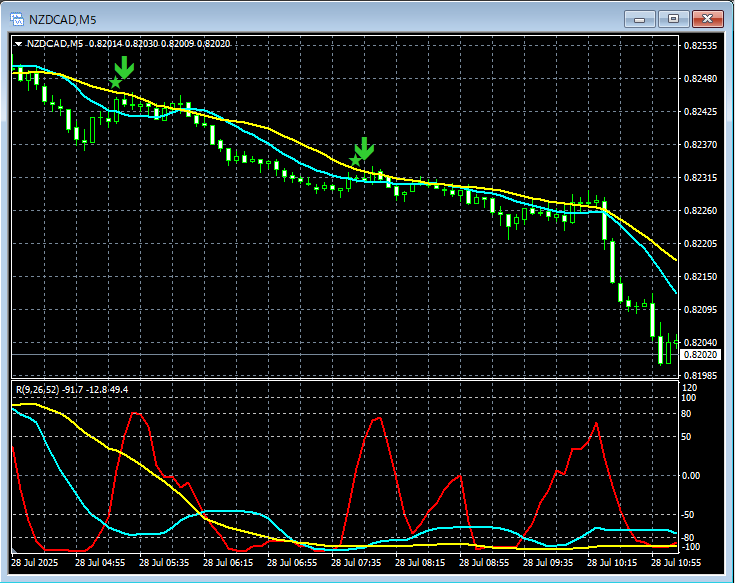
In the 5-minute chart above,mBDSR (Moving Average Filter)exit/return sell signals light up at timely points.
With the Moving Average Filter mBDSRalsowhen used in conjunction with the RCI three-line cross from higher to lower timeframesit enables high-probability trades. This is also explained in the attached PDF.
※The charts used in this article may include circles, lines, or squares for convenience of explanation, please understand.
Indicator that shines when combined with RCI【BODSOR・mBDSR】
and Methods・Case Studies (PDF) ★GogoJungle AWARD 2020 Winner★
https://www.gogojungle.co.jp/tools/indicators/11836
The PDF package includes 358 files (over 1,400 pages, over 470,000 words).
Many of these are documents that detail how to logically link higher and lower timeframes using the three-line RCI to examine multiple lower-timeframe conditions in sequence, ultimately waiting for a dip-buy or pullback-sell timing (i.e., the signals of mBDSR) on the lower timeframes.
Additionally,there are many that focus on identifying points where multiple entry reasons coincide.There are also methods for exploring upside and downside targets using the three-line RCI.
In the PDF explanations,
more than 1,350 chartsare used.

× ![]()


