

【Master RCI to Win!!】Sign of R1R2S2 Euro/Pound 15-minute chart
0
================================
【RCI Related】 Blacksun's Free Indicators and Free eBooks
https://www.gogojungle.co.jp/finance/navi/articles/90181
================================
【Mastering RCI!! Trend Reversal, Buy on Dips, Sell on Rallies】
Indicators that work in combination with RCI【BODSOR・mBDSR】
and Methods・Case Studies (PDF) ★GogoJungle AWARD2020 Winner★
https://www.gogojungle.co.jp/tools/indicators/11836
R1R2S2is included in the above products. For details, please see the article below in Investment Navigator+.
R1R2S2 released! An indicator to target Trend Reversals, Buy on Dips, and Sell on Rallies with a 2-stage confirmation: “R1R2S2”
※This product【BODSOR・mBDSR】includes, as before, 358 PDFs (Total over 1,400 pages, over 1,350 chart pages, over 470,000 characters) as part of the Methods and Case Studies.
※In addition to the above PDFs, there are 31 more PDFs for effectively utilizing R1R2S2 (Methods & Case Studies: over 120 pages, over 115 charts, over 40,000 characters).
PDF Collection to Effectively Utilize R1R2S2【Master RCI and Win!!】
https://www.gogojungle.co.jp/finance/navi/articles/93154
Please refer to the Investment Navigator+ article above for the file names and titles of the PDFs to effectively utilize R1R2S2.
Below, we introduce examples of the signals forR1R2S2signals.
EURGBP – Euro Pound 15-minute chart
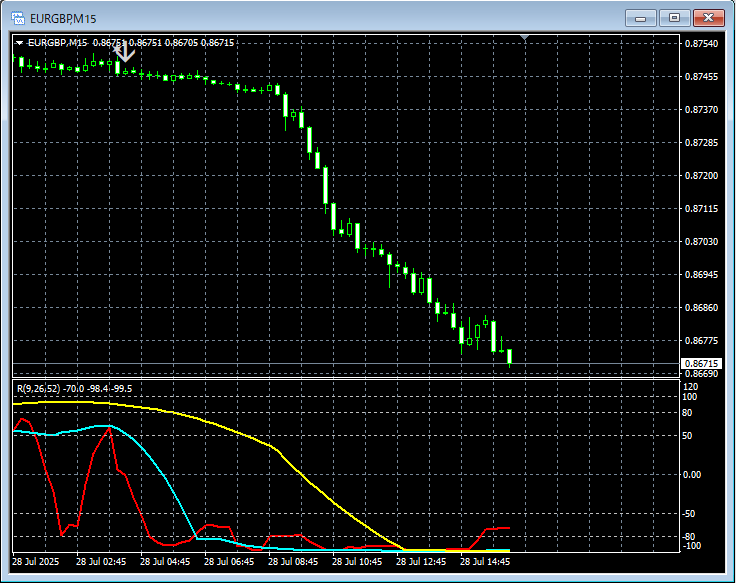
R1R2S2signals
On the 15-minute chart above,R1R2S2’s sell-on-rally signallights up at an opportune timing.
Awaiting mBDSR signals,when the mBDSR signaldoes not light up, is missed, or is late,R1R2S2 signalcan sometimes be used to respond, andR1R2S2is often usedin conjunction withmBDSR.
Powerful indicators when combined with RCI【BODSOR・mBDSR】
and Methods & Case Studies (PDF) ★GogoJungle AWARD2020 Winner★
https://www.gogojungle.co.jp/tools/indicators/11836
Includes over 550 PDF files (Methods & Case Studies: over 1,950 pages, over 690,000 characters).
Most of these areexamples that lay out a process of logically linking higher and lower timeframes using the RCI three-line setup, then progressively considering the status of multiple lower timeframes, ultimately waiting for the timing of dips or rallies (the mBDSR signal) on the lower timeframe..
Also,many items focus on identifying points where multiple entry reasons overlap..
Additionally,there are methods that explore upside and downside targets using the RCI three-line setup..
In the PDF files,over 1,900 chartsare used.

================================
Blacksun Indicators (List)
https://www.gogojungle.co.jp/finance/navi/articles/33779
================================
× ![]()


