

[Master RCI and conquer with moving average filter! EUR/JPY 5-minute chart] mBDSR rebound sell signal
=================
【RCI Related】Free Indigo/indicator and free eBook for Blacksun
https://www.gogojungle.co.jp/finance/navi/articles/90181
=================
【Mastering RCI!! Trend Reversal, Buy on Dips, and Sell on Rallies】
Indicator that shines when combined with RCI【BODSOR・mBDSR】
and methods & case studies (PDF) ★GogoJungle AWARD2020 winner★
https://www.gogojungle.co.jp/tools/indicators/11836
※This product【BODSOR・mBDSR】includes, as methods and case studies, 358 PDFs (over 1,400 pages in total, over 1,350 chart images, more than 470,000 characters).
mBDSR (RCI Filter)andmBDSR (Moving Average Filter)have different roles. The usage distinctions are also discussed in the included PDF.
mBDSR (Moving Average Filter)For a PDF that explains it, see the file name and title in the following Investment Navi+ article.
【Master RCI and Win!!】Summary of PDFs explaining mBDSR (Moving Average Filter)
https://www.gogojungle.co.jp/finance/navi/articles/90127
Below,mBDSR (Moving Average Filter)sign examples are introduced.
EURJPY 5-minute chart
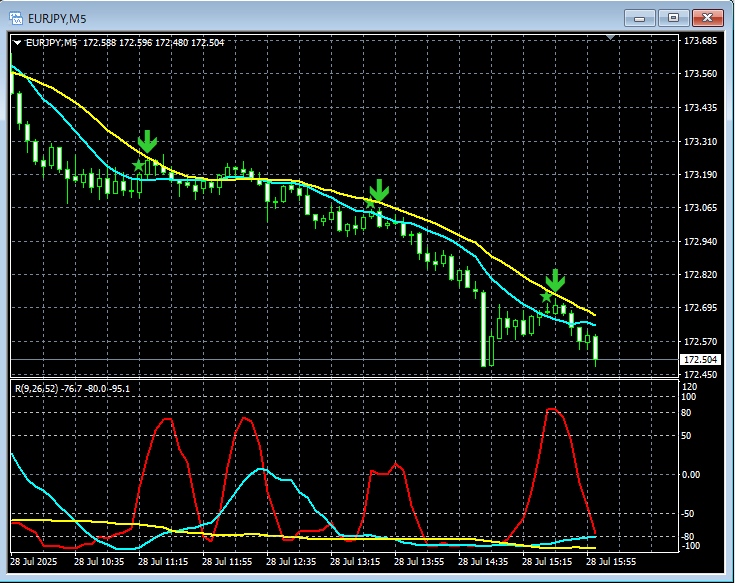
On the 5-minute chart above,the return-selling signal of mBDSR (Moving Average Filter)lights up at the right timing.
In the Moving Average Filter mBDSRcase as well,Using it in conjunction with the higher-timeframe down to lower-timeframe mapping using three RCI linesenables higher-probability trades. This is also explained in theincluded PDF.
Note: For readability, some charts in this article include added circles, lines, and rectangles for explanation.
Indicator that shines when combined with RCI【BODSOR・mBDSR】
and methods & case studies (PDF) ★GogoJungle AWARD2020 winner★
https://www.gogojungle.co.jp/tools/indicators/11836
The PDF file includes 358 documents (over 1,400 pages, over 470,000 characters).
Many of them are structured as logical links between higher-timeframe and lower-timeframe using the three RCI lines, and then examine the status of multiple lower timeframes in sequence, ultimately waiting for a dip buy or a pullback sell signal on the lower timeframe (i.e., an mBDSR signal).
Additionally,many focus on capturing points where multiple entry reasons align..
Furthermore,it also includes methods to explore potential rises or declines using the three RCI lines..
In the PDF explanations,more than 1,350 chartsare used.

× ![]()


