

Master RCI to win!! Sign of R1R2S2 NZDJPY 15-minute chart
0
==============================
[RCI Related] Free Indicators and Free E-books from Blacksun
https://www.gogojungle.co.jp/finance/navi/articles/90181
==============================
[Master RCI!! Trend Reversals, Buy Dips, and Sell Rallies]
Indicator that shines in combination with RCI: BODSOR and mBDSR
and Techniques & Case Studies (PDF) ★GogoJungle AWARD2020 Winner★
https://www.gogojungle.co.jp/tools/indicators/11836
R1R2S2is included in the above product. For details, please see the article below in the Investment Navi+.
RCI 3-liner 'Two-stage Confirmation' to target trend reversals, buying dips, and selling rallies: R1R2S2 released!!
※This product【BODSOR・mBDSR】comes with hundreds of PDFs (from earlier methods & case studies) totaling 358 PDFs (over 1,400 pages, over 1,350 charts, over 470,000 characters).
※In addition to the above PDFs, there are 31 PDFs (methods & case studies: over 120 pages, over 115 charts, over 40,000 characters) to effectively utilize R1R2S2.
PDF Collection to Effectively Utilize R1R2S2【Master RCI and Win!!】
https://www.gogojungle.co.jp/finance/navi/articles/93154
For the file names and titles of the PDFs to effectively utilize R1R2S2, please see the above Investment Navi+ article.
Below, we introduce examples of signals forR1R2S2.
NZD/JPY 15-minute chart
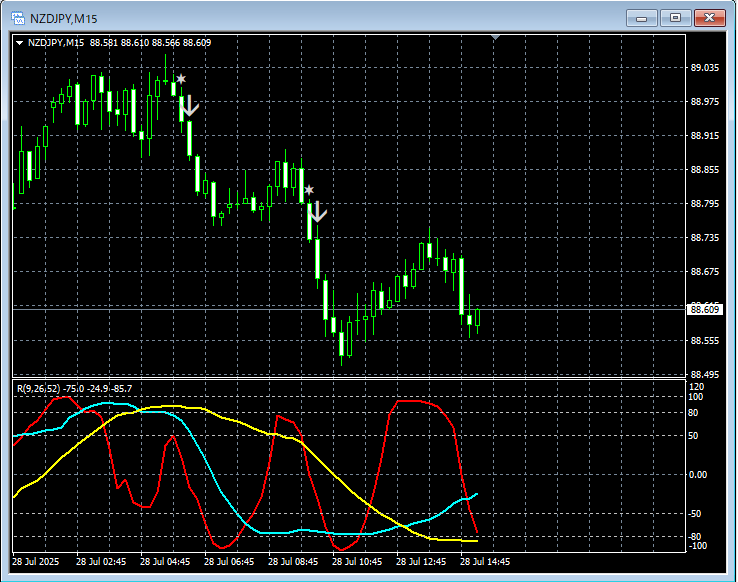
R1R2S2signals
On the 15-minute chart above,R1R2S2 reverse-sell signalslight up twice in a timely manner.
Wait for mBDSR signals,mBDSR signalsdid not light up or were missed or delayed,R1R2S2 signalscan sometimes be used to respond,R1R2S2isoften used in conjunction withmBDSR.
Indicator that shines in combination with RCI: BODSOR and mBDSR
and Techniques & Case Studies (PDF) ★GogoJungle AWARD2020 Winner★
https://www.gogojungle.co.jp/tools/indicators/11836
Includes over 550 PDFs (Methods & Case Studies: over 1,950 pages, over 690,000 characters).
Many of these aresummaries of how to logically link higher and lower timeframes using the RCI three-line setup to sequentially analyze multiple lower-timeframe conditions, ultimately waiting for dips or rallies signals on the lower timeframe (the mBDSR signal)..
Also,there are many that focus on identifying points where multiple entry reasons align..
In addition,there are methods that explore upward and downward targets using the three-line RCI.
In the PDF explanations,over 1,900 chartsare used.

==============================
Blacksun Indicators (List)
https://www.gogojungle.co.jp/finance/navi/articles/33779
==============================
× ![]()


