

【Mastering RCI!!】Trend reversal and signs of R1R2S2 USD/CHF 15-minute chart
==============================
【RCI Related】 Blacksun's Free Indicators and Free E-books
https://www.gogojungle.co.jp/finance/navi/articles/90181
==============================
【Mastering RCI!! Trend Reversal, Buy-the-Dip, and Selling Rallies】
Indicator that shines when combined with RCI: 【BODSOR・mBDSR】
and Methods & Case Studies (PDF) ★GogoJungle AWARD2020 Winner★
https://www.gogojungle.co.jp/tools/indicators/11836
R1R2S2is included in the above products. For details, please read the article below in Invest Navi+.
R1R2S2 Release!! An Indicator That Targets Trend Reversals, Buy-the-Dip, and Selling Rallies with a 2-Stage Confirmation – “R1R2S2”
※This product【BODSOR・mBDSR】also includes 358 PDFs (total over 1,400 pages, over 1,350 chart pages, over 470,000 characters) as methods and case studies from the past.
※Aside from the PDFs above, 31 PDFs (Methods & Case Studies: over 120 pages total, over 115 chart pages, over 40,000 characters) are included to effectively utilize R1R2S2.
PDF Collection for Effectively Using R1R2S2 【Master RCI to Win!!】
https://www.gogojungle.co.jp/finance/navi/articles/93154
Please refer to the Invest Navi+ article above for the file names and titles of the PDFs to effectively use R1R2S2.
Below, we introduce examples of signals forR1R2S2signals.
USD/CHF Dollar Swiss 15-minute chart
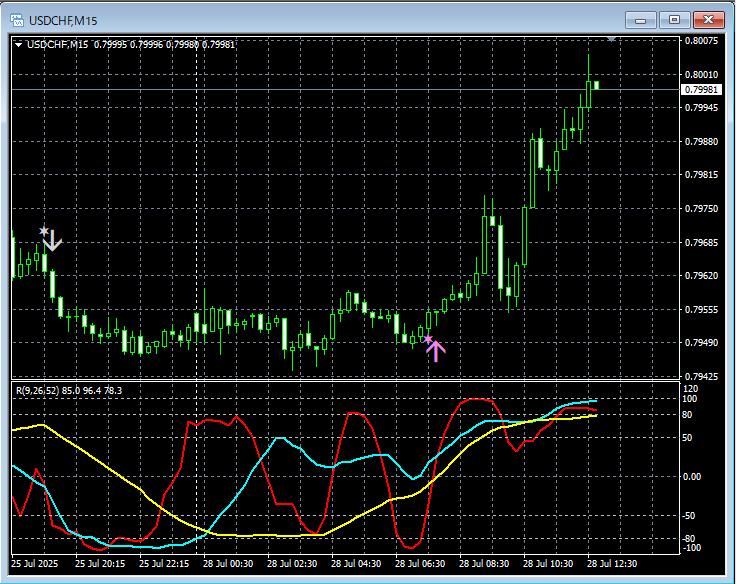
R1R2S2signals
In the 15-minute chart above,Trend reversalaroundR1R2S2 selling the rally signalandR1R2S2 buying the dip signallight up at timely moments.
Waiting for the mBDSR signal,When the mBDSR signaldoes not light up, or you miss the signal or are late,R1R2S2 signalcan be used to respond,R1R2S2isoften used together withmBDSR
Indicators that shine when combined with RCI【BODSOR・mBDSR】
and Methods & Case Studies (PDF) ★GogoJungle AWARD2020 Winner★
https://www.gogojungle.co.jp/tools/indicators/11836
Includes over 550 PDFs (Methods & Case Studies: over 1,950 pages, over 690,000 characters).
Many of these areexamples that logically link higher and lower timeframes using the RCI three-line setup, sequentially considering the conditions of multiple lower timeframes, and ultimately waiting for the timing of buying on dips or selling on rallies (the mBDSR signal)..
Additionally,there are many that focus on capturing points where multiple entry reasons overlap..
Also included is a method to explore upside and downside targets using the RCI three-line setup.
In the PDF explanations,more than 1,900 chartsare used.

==============================
Blacksun Indicators (List)
https://www.gogojungle.co.jp/finance/navi/articles/33779
==============================
× ![]()


