

[Master RCI and win with a moving average filter!! AUDUSD 5-minute chart] mBDSR pullback sell signal
0
=================
【RCI Related】Free indicator and free eBook for Blacksun
https://www.gogojungle.co.jp/finance/navi/articles/90181
=================
【Mastering RCI!! Trend Reversal, Breakout Buying, Drawdown Selling】
Indicators that unleash power when paired with RCI【BODSOR・mBDSR】
and methods / case studies (PDF) ★GogoJungle AWARD2020 win★
https://www.gogojungle.co.jp/tools/indicators/11836
※This product【BODSOR・mBDSR】comes with a total of 358 PDFs (over 1,400 pages, over 1,350 chart pages, over 470,000 characters) as part of its methods and case studies.
mBDSR (RCI filter)andmBDSR (Moving Average filter)have different roles. The accompanying PDFs also discuss how to use them.
mBDSR (Moving Average Filter)For the file names and titles of PDFs that explain this, please see the following Investment Navi+ articles.
【Mastering RCI and Winning!!】Summary of PDFs explaining mBDSR (Moving Average Filter)
https://www.gogojungle.co.jp/finance/navi/articles/90127
Below we introduce examples of signals formBDSR (Moving Average Filter)signals.
AUD/USD 5-minute chart
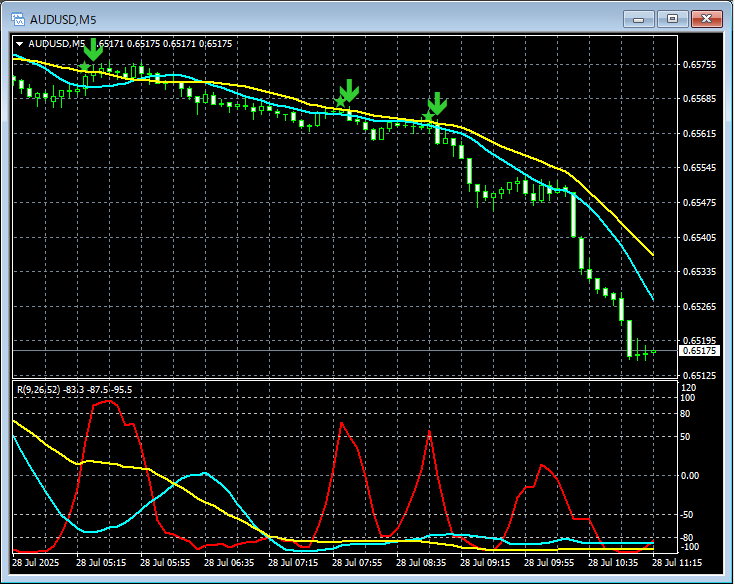
On the 5-minute chart above,mBDSR (Moving Average Filter)sell-off signals are lighting up at good timing.
With Moving Average Filter mBDSRas wellby overlaying with the higher-timeframe RCI three-line breakoutto the lower timeframe, trades with higher edge become possible. This is also explained in theincluded PDF.
※ The charts shown in this article may include circles, straight lines, and rectangles for convenience of explanation, please understand.
Indicators that unleash power when paired with RCI【BODSOR・mBDSR】
and methods / case studies (PDF) ★GogoJungle AWARD2020 win★
https://www.gogojungle.co.jp/tools/indicators/11836
The PDF files total 358 (over 1,400 pages, over 470,000 characters).
Many of these are compilations of cases where, by using the three-line RCI, higher and lower timeframes are logically linked to sequentially consider multiple lower-timeframe conditions, ultimately waiting for breakout or pullback timing (i.e., mBDSR signals) on the lower timeframe.
Also,there are many that focus on capturing points where multiple entry reasons overlap..
Additionally,there are methods to explore upside and downside targets using the RCI three-line model..
In the PDF descriptions,are used.

× ![]()


