

Use both the sign of mBDSR (RCI2 bandpass filter) and the sign of R1R2S2 (40) EURJPY 15-minute chart
===============================
【RCI Related】Free indicator and free e-book for Blacksun
https://www.gogojungle.co.jp/finance/navi/articles/90181
===============================
【Master RCI!! Trend Reversal, Buy on Dips, Sell on Rallies】
Indicators that unleash power when combined with RCI【BODSOR・mBDSR】
and methods & case studies (PDF) ★GogoJungle AWARD2020 winner★
https://www.gogojungle.co.jp/tools/indicators/11836
R1R2S2is included in the products above. For more details, please read the following Investment Navi+ article.
RCI 3-line “two-stage confirmation” Indicator for Trend Reversal, Buy on Dips, and Sell on Rallies: “R1R2S2” Released!!
※This product【BODSOR・mBDSR】includes, in addition to traditional methods and case studies, 358 PDFs (over 1,400 pages, over 1,350 chart sheets, over 470,000 characters).
※In addition to the above PDFs, there are 31 PDFs (methods & case studies: over 120 pages, over 115 charts, over 40,000 characters) to effectively utilize R1R2S2.
PDF collection to effectively utilize R1R2S2【Master RCI!!】
https://www.gogojungle.co.jp/finance/navi/articles/93154
Please see the above Investment Navi+ article for the file names and titles of the PDFs that effectively utilize R1R2S2.
Below,mBDSR (RCI two-filter)andR1R2S2signs are shown simultaneously.
EURJPY 15-minute chart
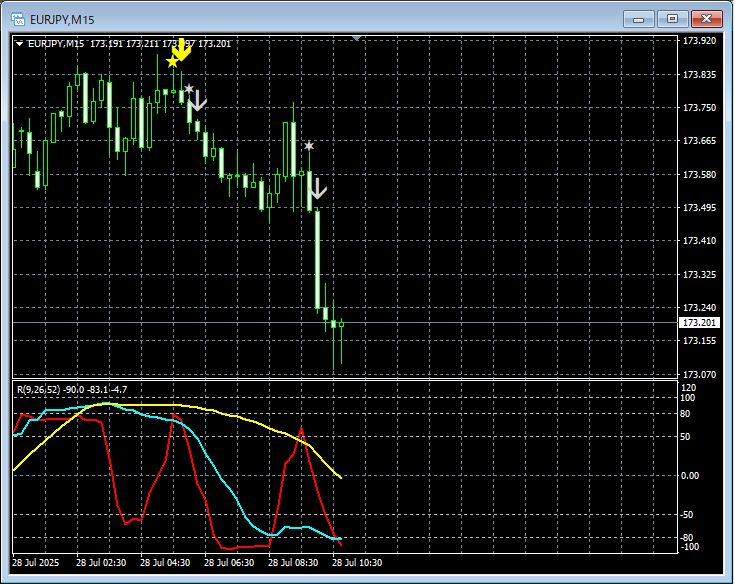
mBDSR (RCI two-filter)andR1R2S2signs
In the 1-hour above,the sell-off (reversal) sign of mBDSR (RCI two-filter)→the sell-off sign of R1R2S2→the sell-off sign of R1R2S2lights up in a timely order.
Using the RCI 3-lineto descend from higher to lower time frames,waiting for mBDSR signsto light up in a setup wherethe mBDSR signdid not light up, was missed, or arrived late,the R1R2S2 signcan be used to respond,R1R2S2isoften used in conjunction withmBDSR
Indicators that excel in combination with RCI【BODSOR・mBDSR】
and methods & case studies (PDF) ★GogoJungle AWARD2020 winner★
https://www.gogojungle.co.jp/tools/indicators/11836
Over 550 PDF files (methods & case studies: over 1,950 pages, over 690,000 characters) are included.
Most of them areexamples that break down how to logically link higher and lower time frames using the RCI 3-line, sequentially examining multiple lower time frames, and finally waiting for a dip-buy or pullback timing (the mBDSR sign) on the lower time frames.
In addition,many are focused on capturing points where multiple entry rationales overlap.
Also included is a method to explore upside and downside targets using the RCI 3-line.
In the PDF explanations,over 1,900 chartsare used.

===============================
Blacksun Indicators (List)
https://www.gogojungle.co.jp/finance/navi/articles/33779
===============================
× ![]()


