

[Master RCI to Win with a Highly Advanced Moving Average Filter!! USDCAD 30-Minute Chart] mBDSR’s Reversal Sell Signal
===============================
【RCI Related】Free indicator and free e-book for Blacksun
https://www.gogojungle.co.jp/finance/navi/articles/90181
===============================
【Mastering RCI!! Trend Reversal, Buy on Dips, Sell on Rallies】
Indicators that unleash power in combination with RCI【BODSOR・mBDSR】
and methods & case studies (PDF) ★GogoJungle AWARD2020 winner★
https://www.gogojungle.co.jp/tools/indicators/11836
※This product【BODSOR・mBDSR】includes 358 PDFs as methods & case studies (total over 1,400 pages, over 1,350 chart pages, over 470,000 words).
mBDSR (RCI Filter)andmBDSR (Moving Average Filter)have different roles. The usage differences are also discussed in the included PDF.
mBDSR (Moving Average Filter)For the file name and title of the PDF that explains it, please refer to the following Investing Navi+ article.
【Master RCI and Win!!】Summary of PDFs explaining mBDSR (Moving Average Filter)
https://www.gogojungle.co.jp/finance/navi/articles/90127
Below we introduce examples of signals formBDSR (Moving Average Filter)signals.
USD/CAD 30-minute chart
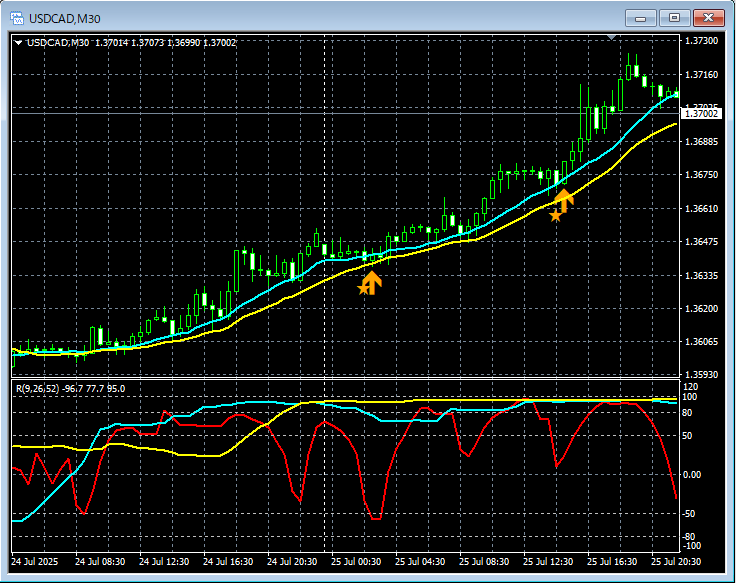
In the 30-minute chart above,mBDSR (Moving Average Filter)buy-the-dip signals light up at timely moments.
For Moving Average Filter mBDSRalsowhen used together with RCI’s triple-line top-down downtrend alignmentit enables higher-probability trades. This is also explained in theIncluded PDF.
※Please note that in the charts shown in this article, for convenience of explanation some circles, lines, and rectangles may have been drawn.
Indicator that shines when combined with RCI【BODSOR・mBDSR】
and methods & case studies (PDF) ★GogoJungle AWARD2020 winner★
https://www.gogojungle.co.jp/tools/indicators/11836
The PDF files number 358 (over 1,400 pages, over 470,000 words).
Many of these are about logically linking higher and lower timeframes using the RCI triple-line, then sequentially examining the conditions of multiple lower-timeframe charts, and finally waiting for dips or rallies signals on the lower timeframe (i.e., mBDSR signals).
Also,there are many that emphasize capturing points where multiple entry reasons coincide..
Additionally,it also includes methods to explore upside and downside targets using the RCI triple-line..
In the PDF explanations,over 1,350 chartsare used.

× ![]()


