

【Master RCI and win with moving average filter!! Latest NZDUSD 30-minute chart】Return-selling signal of mBDSR
=================
【RCI Related】Free Indicator and Free E-Book for Blacksun
https://www.gogojungle.co.jp/finance/navi/articles/90181
=================
【Mastering RCI!! Trend Reversal, Buy the Dips, and Sell on Rallies】
Indicators that shine when combined with RCI【BODSOR・mBDSR】
and Methods / Case Studies (PDF) ★GogoJungle AWARD2020 Winner★
https://www.gogojungle.co.jp/tools/indicators/11836
※This product【BODSOR・mBDSR】includes, as methods and case studies, a total of 358 PDFs (over 1,400 pages in total, more than 1,350 chart pages, over 470,000 characters).
mBDSR (RCI Filter)andmBDSR (Moving Average Filter)have different roles. The usage distinctions are also discussed in the accompanying PDF.
mBDSR (Moving Average Filter)For the PDF that explains it, please see the article below in Investment Navi+ for the file name and title.
【Master RCI and Win!!】Summary of PDFs Explaining mBDSR (Moving Average Filter)
https://www.gogojungle.co.jp/finance/navi/articles/90127
Below, we introduce examples of signals formBDSR (Moving Average Filter)signals.
NZD/USD 30-minute chart
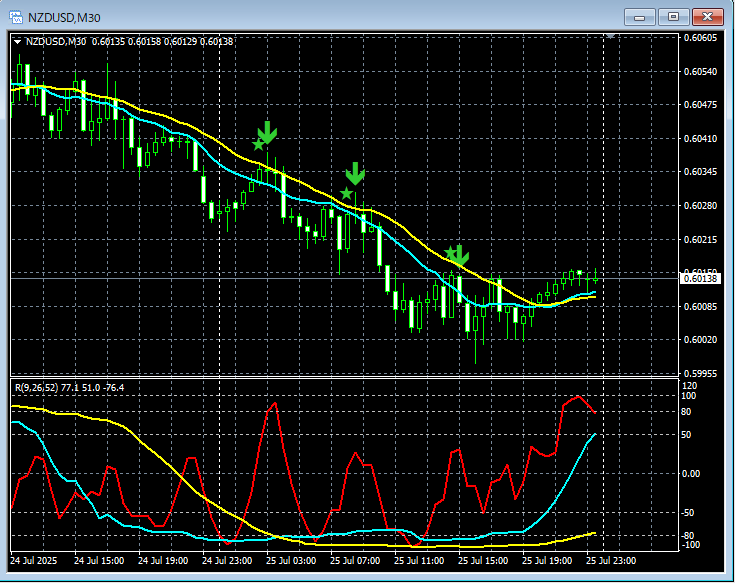
In the 30-minute chart above,mBDSR (Moving Average Filter)sell-rebound signals light up at favorable timing.
For the Moving Average Filter mBDSRas well,by linking from higher timeframes to lower timeframes using the three RCI linesand combining, you can achieve high-probability trades. The accompanying PDF explains this as well.
※ Please note that in the charts presented in this article, for clarity, circles, lines, and rectangles may be drawn.
Indicators that shine when combined with RCI【BODSOR・mBDSR】
and Methods / Case Studies (PDF) ★GogoJungle AWARD2020 Winner★
https://www.gogojungle.co.jp/tools/indicators/11836
The PDF file includes 358 items (over 1,400 pages in total, over 470,000 characters).
Many of them are aboutlogically linking higher and lower timeframes by using the three RCI lines, sequentially considering the conditions of multiple lower timeframes, and ultimately waiting for the dipping buy or rebound sell timing (i.e., the mBDSR signals) on the lower timeframes.This is summarized in the examples.
Also,there are many that emphasize capturing points where multiple entry reasons coincide..
Additionally,there are methods to explore upside and downside targets using the three RCI lines..
The descriptions in the PDF includemore than 1,350 charts..

× ![]()


