

[Master RCI and Win with Extremely Moving Average Filter!! Recent GBP/USD 30-minute Chart] mBDSR’s pullback sell signal
=================
【RCI Related】Free indicator and free e-book for Blacksun
https://www.gogojungle.co.jp/finance/navi/articles/90181
=================
【Master RCI!! Trend Reversal, Buy Dips, Sell Rallies】
Indicators that work powerfully in combination with RCI: 【BODSOR・mBDSR】
and methods / case studies (PDF) ★GogoJungle AWARD2020 winner★
https://www.gogojungle.co.jp/tools/indicators/11836
※This product【BODSOR・mBDSR】includes a total of 358 PDFs (over 1,400 pages, over 1,350 charts, and over 470,000 characters) as methods and case studies.
mBDSR (RCI filter)andmBDSR (Moving Average Filter)have different roles. The accompanying PDF also discusses how to use them distinctly.
mBDSR (Moving Average Filter)For the PDF that explains this, please refer to the article below on Investing Navi+ with the file names and titles.
【Master RCI!!】Summary of PDFs explaining mBDSR (Moving Average Filter)
https://www.gogojungle.co.jp/finance/navi/articles/90127
Below, we introduce examples of signals formBDSR (Moving Average Filter)signals.
GBPUSD 30-minute chart
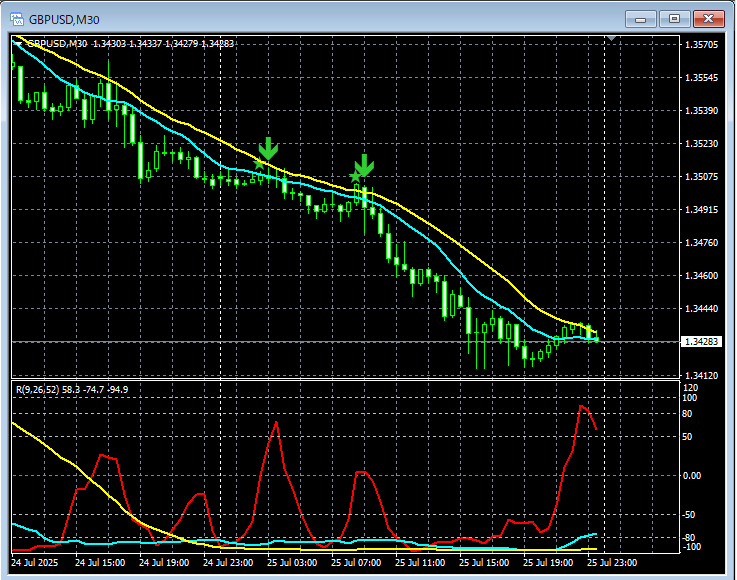
In the 30-minute chart above,mBDSR (Moving Average Filter)sell-on-rally signals light up twice in a timely manner.
In the Moving Average Filter mBDSRas wellWhen used in conjunction with the higher time frame using three RCI linesto drill down from higher to lower timeframes, this allows for high-probability trades. This is also explained in theaccompanying PDF.
※ Please note that charts in this article may include added circles, lines, and rectangles for explanatory convenience.
Indicators that unleash power in combination with RCI【BODSOR・mBDSR】
and methods / case studies (PDF) ★GogoJungle AWARD2020 winner★
https://www.gogojungle.co.jp/tools/indicators/11836
The PDF files amount to 358 files (over 1,400 pages and over 470,000 characters).
Many of them are about logically linking higher and lower timeframes using the three RCI lines, then sequentially examining multiple lower timeframes, ultimately waiting for dip-buying or rally-selling timing (i.e., mBDSR signals) on the lower timeframes.
Additionally,they place emphasis on capturing points where multiple entry bases overlap.There are many of these.
Note thatthe method to explore upside and downside targets using the three RCI lines is also included..
In the PDFs, explanation usesover 1,350 charts.

× ![]()


