

Recent Nikkei Average JP225 4-hour chart [Master RCI to Win Extremely!!]
===============================================
【RCI Related】 Blacksun Free Indicators and Free E-Books
https://www.gogojungle.co.jp/finance/navi/articles/90181
===============================================
【Mastering RCI!! Trend Reversal, Buy Dips, Sell Rallies】
Indicator that shines when combined with RCI: 【BODSOR・mBDSR】
and Methodology & Case Studies (PDF) ★GogoJungle AWARD 2020 Winner★
https://www.gogojungle.co.jp/tools/indicators/11836
R1R2S2is included in the above products. For details, please read the article in the Investment Navi+ below.
RCI 3-line “Two-Stage Confirmation” to Aim for Trend Reversal, Buy the Dip, and Sell the Rally — R1R2S2 Released!!
※The product 【BODSOR・mBDSR】 comes with 358 PDFs as part of the manual & case studies (Total over 1,400 pages, more than 1,350 chart pages, over 470,000 words).
※In addition to the PDFs above, there are 31 PDFs (Methods & Case Studies: over 120 pages, over 115 charts, over 40,000 words) for effectively utilizing R1R2S2.
PDF Collection for Effectively Utilizing R1R2S2【Master RCI and Win!!】
https://www.gogojungle.co.jp/finance/navi/articles/93154
Please refer to the Investment Navi+ article above for the file names and titles of the PDFs that effectively utilize R1R2S2.
Below we introducemBDSR (Two RCI filters)andR1R2S2signs shown simultaneously as an example.
Nikkei Average JP225 4-hour Chart
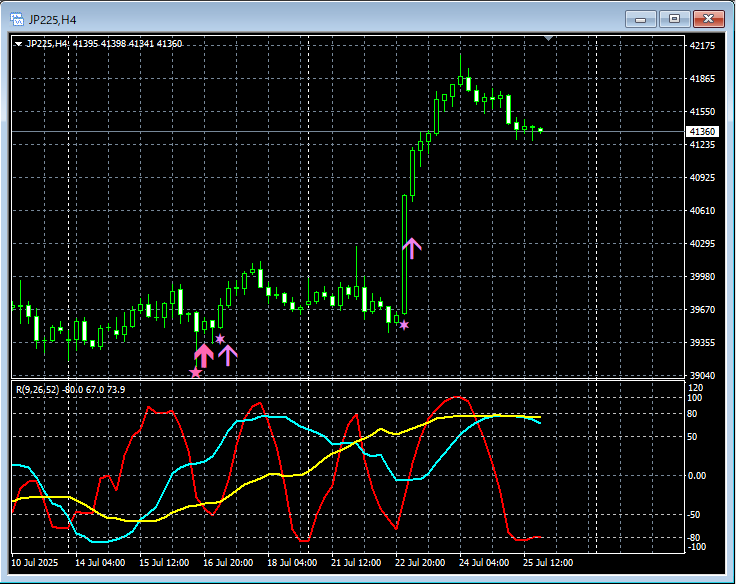
mBDSR (Two RCI filters)andR1R2S2signs
In the above 4-hour chart,the buying-the-dip sign of mBDSR (Two RCI filters)andthe buying-the-dip sign of R1R2S2light up in timely fashion.
RCI Three-Lineis used to drill down from higher to lower timeframesthe sign of mBDSRillumination, bringing it to a setup where you wait for the mBDSR signal to light up,the sign of mBDSRdid not light up, or you missed or were late,the sign of R1R2S2can be used to respond,R1R2S2isoften used in combination withmBDSR
Indicator that shines when combined with RCI: 【BODSOR・mBDSR】
and Methodology & Case Studies (PDF) ★GogoJungle AWARD 2020 Winner★
https://www.gogojungle.co.jp/tools/indicators/11836
Includes over 550 PDF files (Methods & Case Studies: over 1,950 pages, over 690,000 words).
Many of these are aboutusing the RCI 3-line to logically link higher and lower timeframes, examine multiple sub-timeframe conditions sequentially, and ultimately wait for the dip or rally timing (the mBDSR signal) on the lower timeframe.
Additionally,there are many that emphasize capturing points where multiple entry reasons align..
Also included is a method to explore upside and downside targets using the RCI 3-line.
In the PDF explanations,over 1,900 chartsare used.

===============================================
Blacksun Indicators (List)
https://www.gogojungle.co.jp/finance/navi/articles/33779
===============================================
× ![]()


