

Master RCI to the Extreme!! Use mBDSR (Moving Average Filter) (2) NZDUSD
==============================
【RCI Related】Free Indicators and Free eBooks from Blacksun
https://www.gogojungle.co.jp/finance/navi/articles/90181
==============================
【Mastering RCI!! Trend Reversals, Buy-the-Dip, and Sell-the-Rally】
Indicators that work powerfully with RCI in combination with【BODSOR・mBDSR】
and Methods・Case Studies (PDF) ★GogoJungle AWARD 2020 Winner★
https://www.gogojungle.co.jp/tools/indicators/11836
※This product【BODSOR・mBDSR】includes, as standard, 358 PDFs (over 1,400 pages in total, over 1,350 chart pages, over 470,000 characters) of methods and case studies.
mBDSR (RCI Filter)andmBDSR (Moving Average Filter)have different roles. The accompanying PDF also discusses when to use each.
mBDSR (Moving Average Filter)For the PDF file names and titles that explain it, please refer to the article below on Investment Navi+.
【Master RCI and Win!!】Summary of PDFs that explain mBDSR (Moving Average Filter)
https://www.gogojungle.co.jp/finance/navi/articles/90127
Below, we introduce examples of signals formBDSR (Moving Average Filter)signals.
NZD/USD 5-minute chart
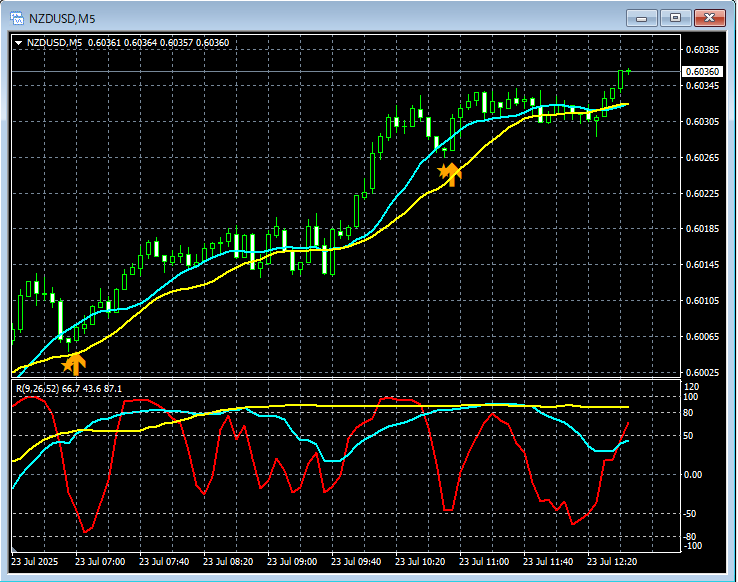
mBDSR (Moving Average Filter)signal
In the 5-minute chart above,the two bullish pullback signals of the MA2-filterlight up perfectly.
Using the three-line RCIto flow from higher timeframes to lower timeframes,the scene where waiting for the mBDSR signalsto light up,did not light up or was missed or delayed,the mBDSR signalthe R1R2S2 signalcan be used in some cases,R1R2S2isoften used in conjunction with mBDSR.
Indicator【BODSOR・mBDSR】that shines in combination with RCI
and Methods・Case Studies (PDF) ★GogoJungle AWARD 2020 Winner★
https://www.gogojungle.co.jp/tools/indicators/11836
Over 550 PDF files (Methods・Case Studies: over 1,950 pages in total, over 690,000 characters) are included.
Most of them areexamples that link multiple higher and lower timeframes logically using three-line RCI, and ultimately break down to waiting for pullbacks or rises (i.e., mBDSR signals) on the lower timeframe.
Additionally,many focus on capturing points where multiple entry reasons overlap..
Also included is a method for exploring upside and downside targets using the RCI three-line setup.
In the PDF explanations,there are over 1,900 charts used..

==============================
Blacksun Indicators (List)
https://www.gogojungle.co.jp/finance/navi/articles/33779
==============================
× ![]()


