

Utilize both the sign of mBDSR (RCI2 bandpass filter) and the sign of R1R2S2 (35) USDJPY 15-minute chart
0
=================================
【RCI Related】Blacksun free indicators and free eBooks
https://www.gogojungle.co.jp/finance/navi/articles/90181
=================================
【Mastering RCI!! Trend Reversal, Buy on Dips, Sell on Rallies】
Indicator that excels when combined with RCI【BODSOR・mBDSR】
and methods / case studies (PDF) ★GogoJungle AWARD2020 winner★
https://www.gogojungle.co.jp/tools/indicators/11836
R1R2S2is included in the above product. For details, please read the article below in Investment Navi+.
RCI 3-lines “2-stage confirmation” to target trend reversals, dips, and rallies – Indicator “R1R2S2” Released!!
(https://www.gogojungle.co.jp/finance/navi/articles/61588)
Also,R1R2S2is supplemented with PDFs (methods & case studies) as appropriate. For details, please read the article below in Investment Navi+.
PDF collection to effectively utilize R1R2S2【Mastering RCI and Winning!!】
(https://www.gogojungle.co.jp/finance/navi/articles/93154)
BelowmBDSR (RCI two-line filter)andR1R2S2signs are shown at the same time as examples.
Dollar/yen USDJPY 15-minute chart
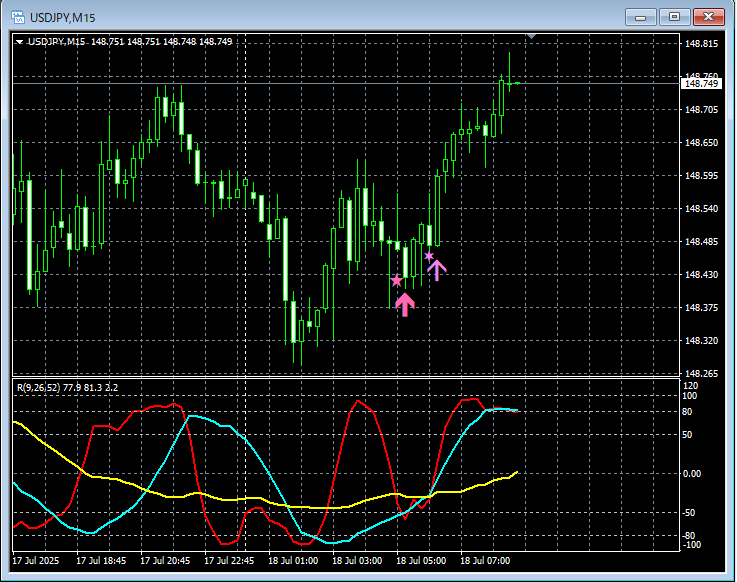
mBDSR (RCI two-line filter)andR1R2S2
On the 15-minute chart above,mBDSR (RCI two-line filter)→R1R2S2dip-buy signal lights up, and the price climbs smoothly.
RCI three-lineis used to filter from higher to lower timeframes, bringingsigns of mBDSRto light in the sequence,when the mBDSR signaldoes not light up, or when you miss or are late to the signal,R1R2S2can be used to respond,R1R2S2isoften used in conjunction withmBDSR.
Indicator that shines with RCI combination【BODSOR・mBDSR】
and methods / case studies (PDF) ★GogoJungle AWARD2020 winner★
https://www.gogojungle.co.jp/tools/indicators/11836
More than 550 PDFs (methods & case studies: over 1,950 pages, over 690,000 characters) included.
Many of these arecollections that describe logically linking higher and lower timeframes using the RCI 3-line to sequentially analyze multiple lower timeframes and ultimately wait for a dip-buy or rally-timing signal on the lower timeframe (i.e., the mBDSR signal).This is what they are about.
Additionally,many focus on capturing points where multiple entry reasons overlap.There are many such examples.
Also included is a method to explore upper targets and downside targets using the RCI 3-line.
In the PDFs,more than 1,900 chartsare used.

=================================
Blacksun Indicators (List)
https://www.gogojungle.co.jp/finance/navi/articles/33779
=================================
× ![]()


