

[Mastering RCI!!] Signals of Double Top, Pressing Low, and mBDSR AUDJPY 1-Hour Chart
0
===============================
【RCI Related】Free indicator and free eBook for Blacksun
https://www.gogojungle.co.jp/finance/navi/articles/90181
===============================
【Mastering RCI!! Trend Reversal, Buy the Dip, Sell on Rebound】
Indicators that unleash power when combined with RCI【BODSOR・mBDSR】
and methods & case studies (PDF) ★GogoJungle AWARD2020 Winner★
https://www.gogojungle.co.jp/tools/indicators/11836
AUD/JPY 1-hour chart
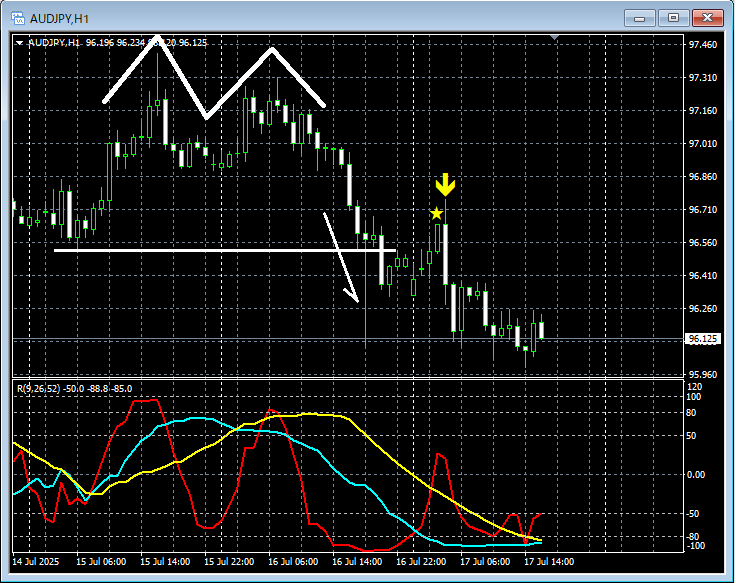
mBDSR (RCI two-filter)signal
On the above 1-hour chart,Double topis formed,and after breaking below the pullback lowthe rising price triggers themBDSR (RCI two-filter) sell impulsesignal, and the price continues to fall.
Indicators that unleash power when combined with RCI【BODSOR・mBDSR】
and methods & case studies (PDF) ★GogoJungle AWARD2020 Winner★
https://www.gogojungle.co.jp/tools/indicators/11836
More than 500 PDF files (methods & case studies: over 1,850 pages, over 650,000 characters in total) are included.
Most of them are aboutusing three RCI lines to logically link higher and lower timeframes, then sequentially examining multiple lower-timeframe conditions, ultimately waiting for a dip buy or rebound sell timing (the mBDSR signal) on the lower timeframes..
Also,many focus on identifying points where multiple entry signals align..
Additionally,there are techniques for exploring upside and downside targets using three RCI lines..
In the PDF explanations,more than 1,800 chartsare used.

===============================
Blacksun Indicators (List)
https://www.gogojungle.co.jp/finance/navi/articles/33779
===============================
× ![]()


