

Master RCI!! Use the signs of R1R2S2 (17) USD/CHF
0
================================
【RCI Related】 Blacksun's Free Indicators and Free eBooks
https://www.gogojungle.co.jp/finance/navi/articles/90181
================================
【Mastering RCI!! Trend Reversals, Buy Dips, and Sell Rallies】
Indicators that work powerful with RCI when combined【BODSOR・mBDSR】
and Methods · Case Studies (PDF) ★GogoJungle AWARD2020 Winner★
https://www.gogojungle.co.jp/tools/indicators/11836
R1R2S2is included in the above products. For details, please see the Investment Navi+ article below.
RCI Three-Line “Two-Step Confirmation” to Target Trend Reversals, Buy Dips, and Sell Rallies: R1R2S2 Released!!
※This product【BODSOR・mBDSR】comes with 358 PDFs (total over 1,400 pages, over 1,350 charts, over 470,000 words) as a method and case studies from the original release.
※In addition to the above PDFs, there are 31 PDFs (methods and case studies: over 120 pages, over 115 charts, over 40,000 words) to effectively utilize R1R2S2.
PDF Collection to Effectively Utilize R1R2S2【Master RCI and Win!!】
https://www.gogojungle.co.jp/finance/navi/articles/93154
For the file names and titles of the PDFs to effectively use R1R2S2, please refer to the above Investment Navi+ article.
Below, we introduce examples of signs forR1R2S2signals.
USD/CHF - US Dollar vs Swiss Franc 4-hour chart
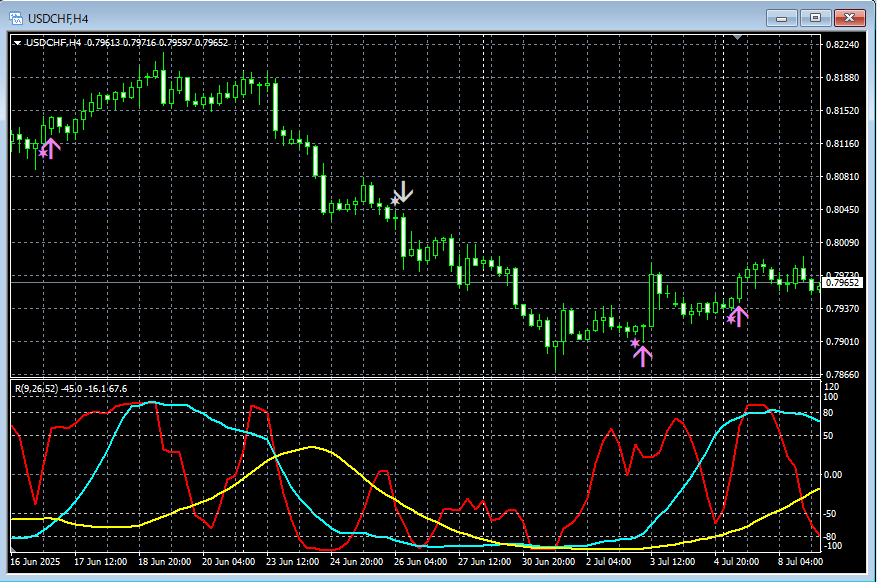
R1R2S2signals
On the 4-hour chart above,Buy-the-dip signal of R1R2S2andSell-the-rally signal of R1R2S2are lighting up at timely points.
Waiting for mBDSR signal,mBDSR signaldid not light up or you missed or were late,R1R2S2 signalcan sometimes be used to respond,R1R2S2isoften used together withmBDSR.
Indicators that work powerfully in combination with RCI【BODSOR・mBDSR】
and methods · case studies (PDF) ★GogoJungle AWARD2020 Winner★
https://www.gogojungle.co.jp/tools/indicators/11836
Includes more than 550 PDF files (methods and case studies: total over 1,950 pages, over 690,000 words).
Many of these summarize examples that logically link higher and lower timeframes using the RCI Three-Line, gradually considering multiple lower-timeframe situations and ultimately waiting for dips or rallies on the lower timeframe (i.e., the mBDSR signal)..
Also,many focus on identifying points where multiple entry reasons align..
Additionally,they include methods to explore upward and downward targets using the RCI Three-Line..
In the PDF explanations,there are over 1,900 charts used..

================================
Blacksun Indicators (List)
https://www.gogojungle.co.jp/finance/navi/articles/33779
================================
× ![]()


