

【RCI3 main line + mBDSR】NZDUSD Weekly chart pullback buy signal
BODSOR (mBDSR)The sales page forhere.
※ BODSOR and mBDSR are indicators developed to improve the accuracy of entries when using three RCIs (RCI3 lines) for buy-the-dips or sell-the-rises.
They are designed to help with entry precision in these scenarios.
The figure below is a weekly chart of NZDUSD.
NZDUSD Weekly
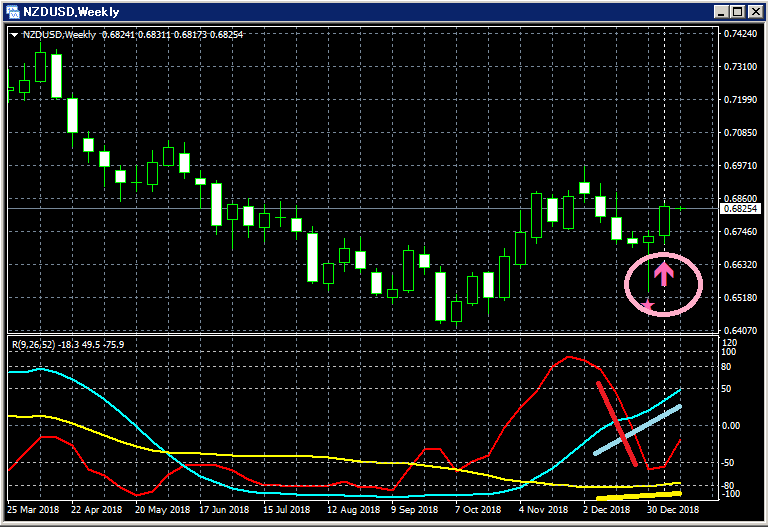
Upper panel: mBDSR
Lower panel: RCI three-line (red: RCI9, light blue: RCI26, yellow: RCI52)
Among the three RCI lines, only RCI9 is clearly turning downward.
If RCI9 reverses and rises, there is a possibility that all three RCIs will rise together.
In other words, price may also rise strongly.
In such a situation, mBDSR’s pullback-buy signal (pink arrow circled) lights up.
The signal lit at the opening price of last week, and last week produced a solid bullish candlestick.
The sales page for (mBDSR) for BODSOR.

Twitter
https://twitter.com/RCIX3Line
Blog
http://bodsor.blog.fc2.com/
Invest Navi+
https://fx-on.com/navi/serial/?id=359
YouTube
https://www.youtube.com/channel/UCL-g5uAlesiWVJEDtWlFvGw
Examples of pullback-buy and retracement-sell signals on the 1-hour USD/JPY chart
※Please note that in the charts within this article, for convenience of explanation, some lines, circles, and rectangles may be drawn in yen, straight lines, or boxes.
Thank you for your understanding.


