

Master RCI to win!! Utilize the signs of R1R2S2 (15) AUDJPY Pay attention to moving averages
=================
【RCI Related】Blacksun Free Indicator and Free eBooks
https://www.gogojungle.co.jp/finance/navi/articles/90181
=================
【Mastering RCI!! Trend Reversals, Buy-the-Dip, and Sell-the-Rally】
Indicators that synergize with RCI: 【BODSOR・mBDSR】
and methods & case studies (PDF) ★GogoJungle AWARD 2020 Recipient★
https://www.gogojungle.co.jp/tools/indicators/11836
R1R2S2is included in the above product. For details, please read the article below in Investment Navi+.
RCI 3-line “Two-Stage Confirmation” to target trend reversals, buy-the-dip, and sell-the-rally: R1R2S2 released!!
※This product 【BODSOR・mBDSR】 comes with 358 PDFs (total over 1,400 pages, more than 1,350 charts, over 470,000 characters) as part of its methods & case studies compared to before.
※In addition to the above PDFs, there are 31 PDFs (methods & case studies: over 120 pages, over 115 charts, over 40,000 characters) included for effectively utilizing R1R2S2.
PDF Collection to Effectively Utilize R1R2S2【Master RCI and Win!!】
https://www.gogojungle.co.jp/finance/navi/articles/93154
Please refer to the Investment Navi+ article above for the file names and titles of the PDFs that effectively utilize R1R2S2.
Below, we introduce examples of signals forR1R2S2.
AUD/JPY 15-minute chart
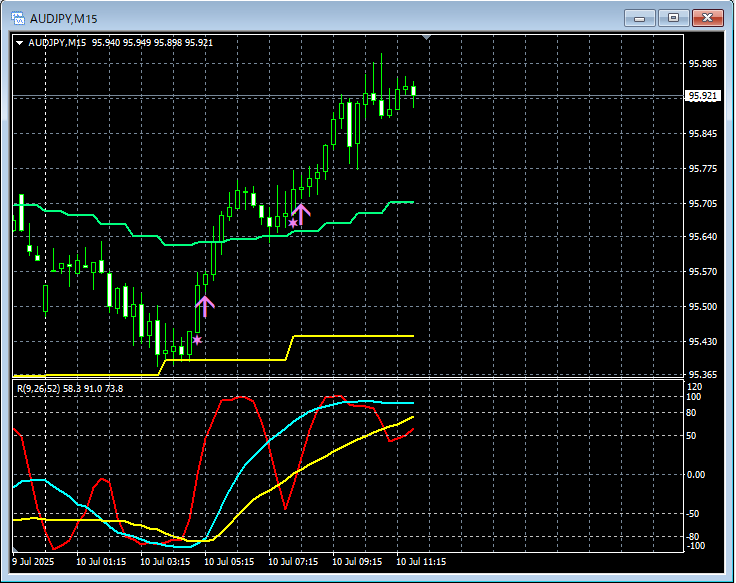
R1R2S2Signal
In the 15-minute chart above,near the 4-hour EMA21, after a rebound, andnear the 1-hour EMA21after a rebound,R1R2S2 buy-the-dip signallights up at the right timing.
Waiting for the mBDSR signal; if themBDSR signaldoes not light up, or you miss it or are late,R1R2S2 signalcan be used to respond,R1R2S2is often usedin conjunction withmBDSR.
An indicator that shines in combination with RCI: 【BODSOR・mBDSR】
and methods & case studies (PDF) ★GogoJungle AWARD 2020 Recipient★
https://www.gogojungle.co.jp/tools/indicators/11836
Over 550 PDFs are included (methods & case studies: total over 1,950 pages, over 690,000 characters).
Many of these are aboutlogically linking higher and lower timeframes using the RCI 3-line, sequentially examining multiple lower timeframes, and ultimately waiting for the dip-buying or rally-selling timing (the mBDSR signal) on the lower timeframes..
In addition,many focus on capturing points where multiple entry reasons overlap..
Also included is a method for exploring upside and downside targets using the RCI three-line.
In the PDF explanations,more than 1,900 chartsare used.

=================
Blacksun Indicators (List)
https://www.gogojungle.co.jp/finance/navi/articles/33779
=================
× ![]()


