

Utilize both the sign of mBDSR (RCI2 main filter) and the sign of R1R2S2 (33) USD/JPY 1-minute chart
==========================================
【RCI Related】Free Indicators and Free E-Books for Blacksun
https://www.gogojungle.co.jp/finance/navi/articles/90181
==========================================
【Mastering RCI!! Trend Reversal, Buy on Dips, Sell on Rises】
Indicators that excel in combination with RCI【BODSOR・mBDSR】
and methods & case studies (PDF) ★GogoJungle AWARD 2020 Winner★
https://www.gogojungle.co.jp/tools/indicators/11836
R1R2S2is included in the above products. For details, please see the article below in the Investment Navigator+.
RCI triple-line “2-stage confirmation” to target trend reversals, dips, and pullbacks—Indicator “R1R2S2” Release!!
(https://www.gogojungle.co.jp/finance/navi/articles/61588)
Also,R1R2S2is complemented by PDFs (methods & case studies) added as appropriate. For details, please see the article below in the Investment Navigator+.
PDF collection to effectively utilize R1R2S2【Master RCI and Win!!】
(https://www.gogojungle.co.jp/finance/navi/articles/93154)
Below,mBDSR (Two-line RCI filter)andR1R2S2signs are displayed simultaneously in the example.
USD/JPY 1-minute chart
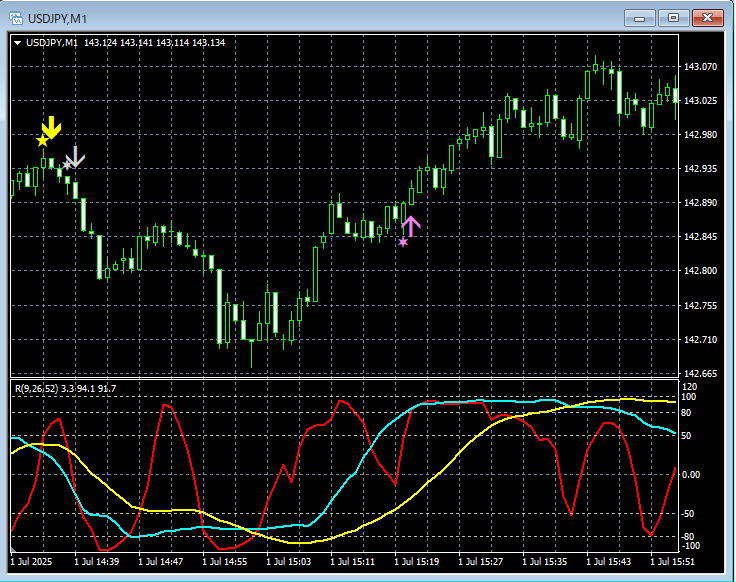
mBDSR (Two-line RCI filter)andR1R2S2
In the top 1-minute chart,the selling (pullback) signal of the mBDSR (Two-line RCI filter)→the selling (pullback) signal of R1R2S2lights up in sequence and price declines. Afterwards, a reversal to an uptrend occurs.The buying-on-dips signal of R1R2S2lights up in time, and price rises further.
RCI triple-lineis used to filter down from higher to lower timeframes,waiting for the signals of mBDSRto light up,andif the mBDSR signal does not light up, or if you miss or delay the signal,R1R2S2signals may be used to respond,R1R2S2isoften used in conjunction withmBDSR.
Indicators that excel in combination with RCI【BODSOR・mBDSR】
and methods & case studies (PDF) ★GogoJungle AWARD2020 Winner★
https://www.gogojungle.co.jp/tools/indicators/11836
More than 550 PDFs (methods & case studies: over 1,950 pages, over 690,000 characters) are included.
Many of these areexamples where higher and lower timeframes are logically linked using the RCI triple-line, sequentially examining multiple lower timeframes, and ultimately waiting for the dips or pullbacks timing (i.e., mBDSR signals) on the lower timeframes.
Also,many entries focus on capturing points where multiple entry reasons cluster..
Note thatthere are also methods that explore upward targets or downside targets using the RCI triple-line..
In the PDF explanations,over 1,900 chartsare used.

==========================================
Blacksun Indicators (List)
https://www.gogojungle.co.jp/finance/navi/articles/33779
==========================================
× ![]()


