

Achieve mastery of RCI!! Utilize both signals from mBDSR (moving average filter) and R1R2S2 (6) Dow Jones US30
=================
【RCI Related】Free indicator and free e-book from Blacksun
https://www.gogojungle.co.jp/finance/navi/articles/90181
=================
【Mastering RCI!! Trend Reversal, Buy on Dips, Sell on Rallies】
An indicator that shines when combined with RCI: 【BODSOR・mBDSR】
and method & case studies (PDF) ★GogoJungle AWARD2020 winner★
https://www.gogojungle.co.jp/tools/indicators/11836
R1R2S2is included in the above products. For details, please read the article below in Investment Navi+.
RCI 3-line “two-stage confirmation” to target trend reversal, buy on dips, and sell on rallies: R1R2S2 released!!
Below,mBDSR (Moving Average filter)andR1R2S2signs are shown simultaneously as an example.
Dow Jones Average US30 4-hour chart
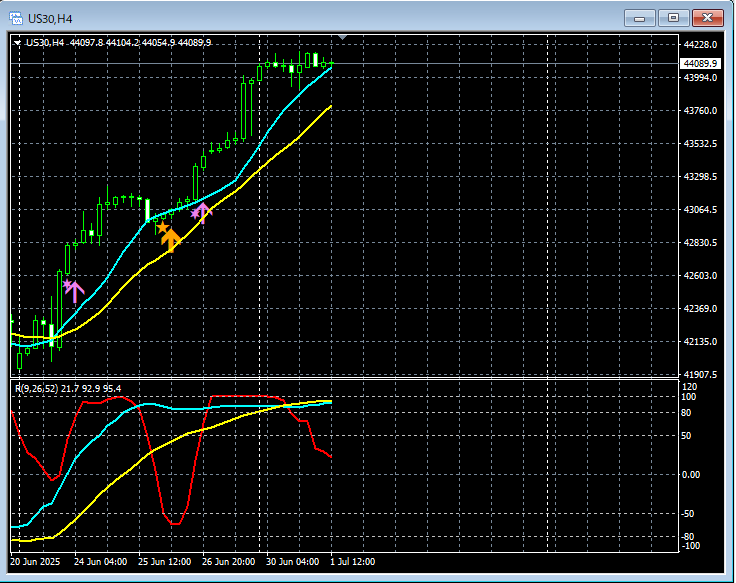
mBDSR (MA two-filter)andR1R2S2
In the above 4-hour chart,the buy-on-dip signal of mBDSR (MA two-filter)appears once,the buy-on-dip signal of R1R2S2appears twice at timely points.
RCI three-lineis used to cascade from higher to lower timeframesand bring in the signals of mBDSRuntil a state where you wait for the mBDSR signals to light up.If the mBDSR signals do not light up, or you miss or are late,the signals of R1R2S2can be used to respond in some cases, andR1R2S2is often used in combination withmBDSRfor better results.
Indicator that shines when combined with RCI: 【BODSOR・mBDSR】
and method & case studies (PDF) ★GogoJungle AWARD2020 winner★
https://www.gogojungle.co.jp/tools/indicators/11836
There are over 550 PDF files included (methods & case studies: over 1,950 pages, over 690,000 characters).
Many of these areexamples that logically link higher and lower timeframes using the RCI three-line, examining multiple lower-timeframe conditions sequentially and ultimately waiting for the dip-buying or rally-selling timing on the lower timeframes (i.e., the mBDSR signals).This is what they amount to.
Additionally,many emphasize identifying points where multiple entry reasons overlap.
In addition,there is also a method to explore upside and downside targets using the RCI three-line..
In the PDF explanations,over 1,900 chartsare used.

=================
Blacksun's Indicators (List)
https://www.gogojungle.co.jp/finance/navi/articles/33779
=================
× ![]()


