

【Master RCI to Win!!】Using the signs of R1R2S2 (14) EUR/USD Pay attention to the moving average
===============================================
【RCI Related】 Blacksun's Free Indicators and Free E-Books
https://www.gogojungle.co.jp/finance/navi/articles/90181
===============================================
【Mastering RCI!! Trend Reversal, Buy on Dips, and Sell on Rallies】
Indicators that pair with RCI for power【BODSOR・mBDSR】
and Methods・Case Studies (PDF) ★GogoJungle AWARD2020 Winner★
https://www.gogojungle.co.jp/tools/indicators/11836
R1R2S2is included in the above products. For details, please see the article below in the Investment NAV+.
RCI Three-Line “Two-Stage Confirmation” to Target Trend Reversal, Dip Buying, and Rally Selling Indicator “R1R2S2” Release!!
(https://www.gogojungle.co.jp/finance/navi/articles/61588)
Also,R1R2S2is supported by PDFs (Methods・Case Studies) added as appropriate. For details, please see the article below in the Investment NAV+.
PDF Collection for Effectively Using R1R2S2【Master RCI and Win!!】
(https://www.gogojungle.co.jp/finance/navi/articles/93154)
Below, we introduce examples of signals forR1R2S2.
EURUSD – Euro Dollar 1-Hour Chart
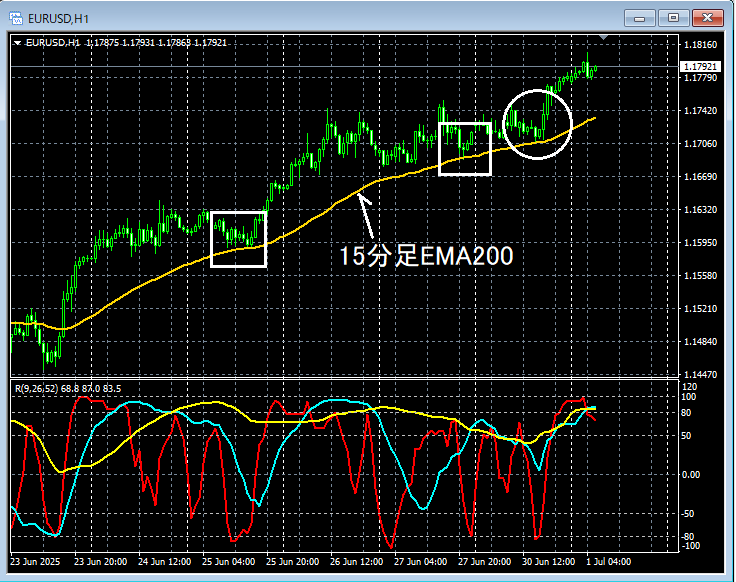
Looking at the area surrounded by the white box on the 1-hour chart above,15-minute EMA200is functioning as support. In the area circled in white, it is again15-minute EMA200nearby, so we will watch cautiously for any signs of a rebound on the lower time frame.
Euro Dollar – EURUSD 5-Minute Chart
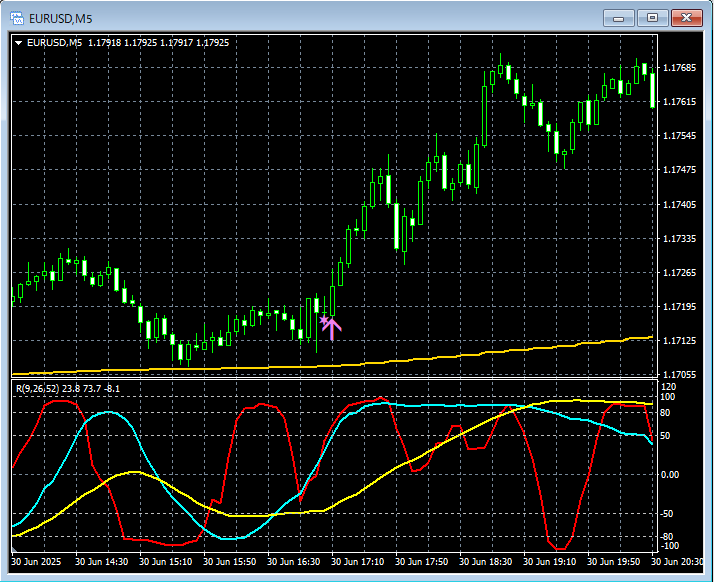
R1R2S2signal
On the 5-minute chart above,15-minute EMA200is showing a rebound tendency nearby.R1R2S2buy-the-dip signal lights up and price rises significantly.
Using the RCI Three-Lineto descend from higher to lower timeframes,mBDSR signalis waited for, and in a situation where themBDSR signaldoes not light up, or when a signal is missed or late,R1R2S2 signalmay be used as a substitute, andR1R2S2is often used in conjunction withmBDSR.
Indicators that pair powerfully with RCI【BODSOR・mBDSR】
and Methods・Case Studies (PDF) ★GogoJungle AWARD2020 Winner★
https://www.gogojungle.co.jp/tools/indicators/11836
Over 550 PDF files (Methods・Case Studies: over 1,950 pages, over 690,000 words) are included.
Most of them areexamples that drill down the status of multiple lower timeframes by logically linking higher and lower timeframes using the RCI Three-Line, ultimately waiting for a dip-buy or rally-sell timing (the mBDSR signal)..
Additionally,many entries focus on identifying points where multiple entry factors coincide..
Also included is a method to explore ascent and descent targets using the RCI Three-Line.
In the PDF explanations,more than 1,900 charts are used.

===============================================
Blacksun Indicators (List)
https://www.gogojungle.co.jp/finance/navi/articles/33779
===============================================
× ![]()


